
Discover powerful Dolibarr extensions designed to automate your business processes
IoT Manager Enterprise turns Dolibarr ERP & CRM into a full Enterprise...
Couldn't load pickup availability


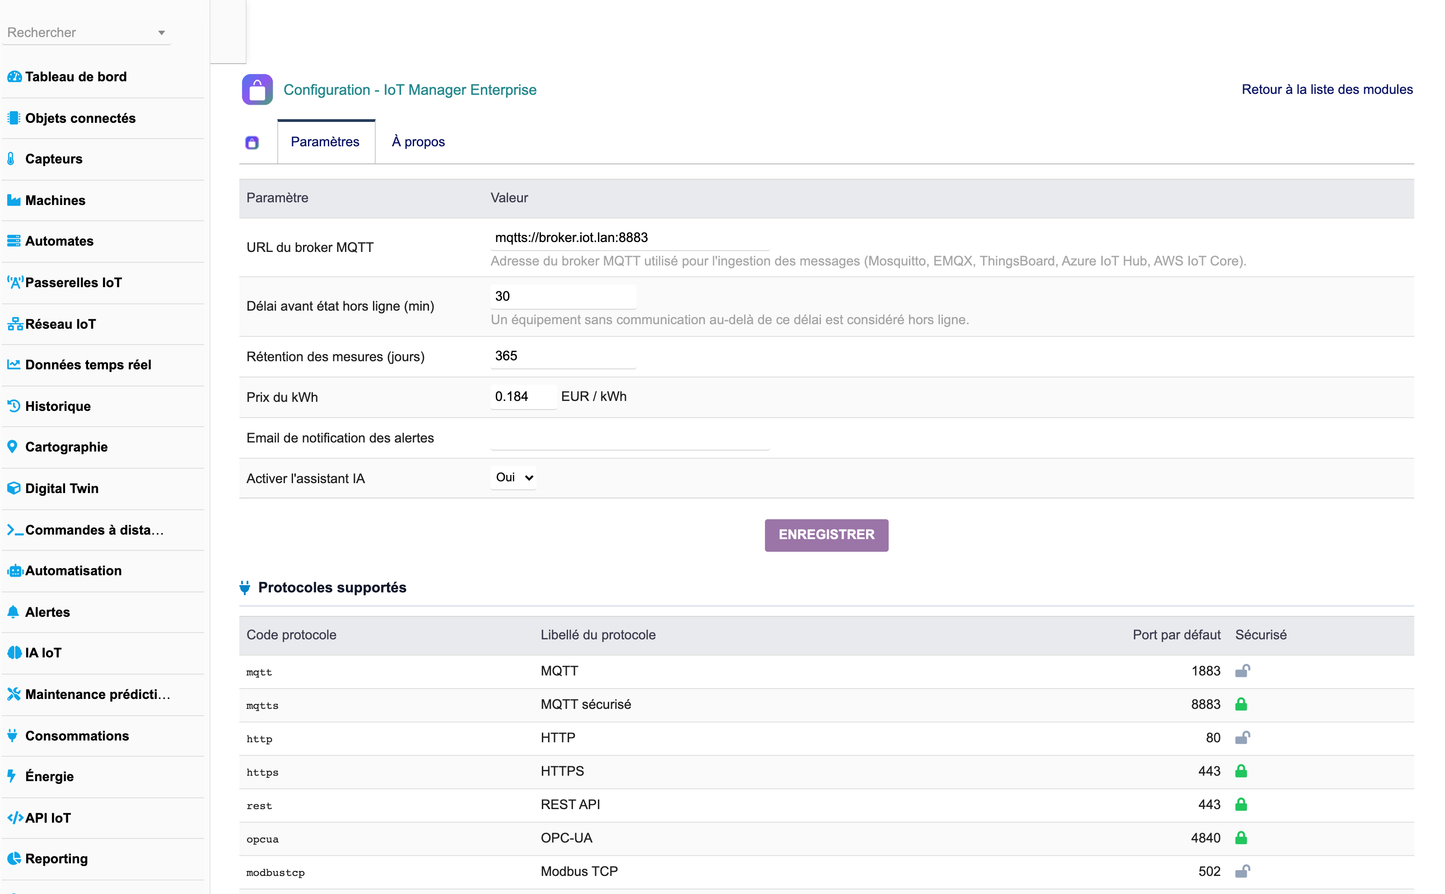
IoT Manager Enterprise turns Dolibarr ERP & CRM into a full Enterprise IoT Management Platform. It lets an organisation connect, supervise, control and analyse every connected object directly from Dolibarr, with no external IoT platform required.
The module covers the whole IoT chain — from the field gateway up to decision-support reporting — and targets industry, logistics, smart buildings, energy, connected agriculture and infrastructure. It is designed for Industry 4.0 and Industry 5.0.
· Sites and installations — factories, warehouses, technical platforms, power plants and buildings, with GPS position, surface and installed power.
· IoT gateways — multi-protocol collection with broker, port, TLS, firmware, throughput and uptime.
· Connected devices — 20 categories, full identity, connectivity, battery, signal, criticality and last communication.
· Sensors and measures — 20 physical quantities, thresholds, quality and real-time historised time series.
· Machines and OEE — availability, performance, quality, cycle time, produced and rejected parts.
· PLC controllers — brand, protocol, port, slave id, register map and scan rate.
· IoT network — subnets, VLAN, bandwidth, latency, packet loss, coverage and encryption.
· Real-time collection — streaming, historisation, aggregation, filtering, validation and anomaly detection.
· Mapping — interactive GPS view of sites, devices and alarms, colour-coded by state.
· Digital Twin — 3D view (architecture ready), real-time state, variables, health score, KPIs and documentation.
· Remote commands — start, stop, restart, set parameters, enable, disable, reset — fully historised.
· Automation — IF / THEN rule engine on thresholds, events and cron schedules.
· Smart alarms — 4 severities, 8 triggers, acknowledgement and notification actions.
· Predictive maintenance — failure probability, remaining useful life, MTBF, MTTR, health index and cost.
· Energy — electricity, water, gas, fuel, steam and compressed air, with cost, efficiency and CO2.
· Artificial intelligence — natural-language assistant over live IoT data.
· REST API — ingestion, read, control and history, secured by API keys and JWT.
· Security — TLS, JWT, API keys, certificates and a timestamped audit log.
· SCADA dashboard — real-time KPIs, OEE gauges, charts, map and drag-and-drop widgets.
· Reporting — 10 cross-functional reports exportable to PDF, Excel, CSV and Word.
The module implements the standard layered IoT architecture, entirely inside Dolibarr.
|
Layer |
Component |
Role |
|
Field |
Connected devices, sensors, PLC controllers |
Produce measures and accept commands |
|
Edge |
IoT Gateway |
Collect, buffer and forward field data to the broker |
|
Transport |
MQTT Broker Connector, OPC-UA, Modbus, LoRaWAN, REST, WebSocket, AMQP, SNMP, BACnet |
Carry telemetry and commands |
|
Ingestion |
Device Manager, Event Processing Engine |
Register devices, validate, filter and aggregate |
|
Storage |
Time Series Database (measures) |
Historise every reading with quality and anomaly flag |
|
Logic |
Rules Engine, Notification Engine |
Apply IF / THEN automation and raise alarms |
|
Intelligence |
AI Analytics, Predictive Maintenance |
Detect anomalies, predict failures, optimise consumption |
|
Representation |
Digital Twin |
Mirror each physical asset with live variables and KPIs |
|
Presentation |
Dashboard IoT, Mapping, Reporting |
Supervise, decide and export |
|
Integration |
REST API, WebSocket Manager |
Expose everything to third-party systems |
The architecture is designed to interoperate with the standard IoT ecosystem:
· Brokers: Mosquitto, EMQX, ThingsBoard
· Industrial: OPC-UA Server, Modbus TCP/RTU, BACnet
· Flow and streaming: Node-RED, Apache Kafka (evolution)
· Time series and visualisation: InfluxDB (future historisation), Grafana (interoperability)
· Cloud: Azure IoT Hub, AWS IoT Core
The module ships 21 business objects, each with its own table, class, list and card:
|
# |
Object |
Table |
Purpose |
|
1 |
Site |
llx_iot_site |
Physical site or installation (GPS, power) |
|
2 |
Gateway |
llx_iot_gateway |
IoT gateway / broker endpoint |
|
3 |
Device |
llx_iot_device |
Connected object (hub) |
|
4 |
Sensor |
llx_iot_sensor |
Sensor attached to a device |
|
5 |
Measure |
llx_iot_measure |
Time-series reading |
|
6 |
Machine |
llx_iot_machine |
Production machine with OEE |
|
7 |
PLC |
llx_iot_plc |
Industrial controller |
|
8 |
Network |
llx_iot_network |
IoT network segment |
|
9 |
Protocol |
llx_iot_protocol |
Communication protocol reference |
|
10 |
Device type |
llx_iot_devicetype |
Device category reference |
|
11 |
Alarm |
llx_iot_alarm |
Raised alarm |
|
12 |
Alarm rule |
llx_iot_alarmrule |
Threshold / trigger definition |
|
13 |
Command |
llx_iot_command |
Remote command sent to a device |
|
14 |
Automation |
llx_iot_automation |
IF / THEN rule |
|
15 |
Twin |
llx_iot_twin |
Digital twin of an asset |
|
16 |
Maintenance |
llx_iot_maintenance |
Predictive maintenance record |
|
17 |
Energy |
llx_iot_energy |
Energy consumption record |
|
18 |
AI analysis |
llx_iot_ai |
AI analysis result |
|
19 |
API key |
llx_iot_apikey |
API credential |
|
20 |
Audit |
llx_iot_audit |
Security / audit event |
|
21 |
Firmware |
llx_iot_firmware |
Firmware version |
Every connected object is described by a complete identity, connectivity and operational record.
|
Group |
Fields |
|
Identity |
Reference, name, type, category, manufacturer, model, serial number |
|
Connectivity |
IP address, MAC address, IoT identifier (URN), protocol, firmware, version |
|
Lifecycle |
Install date, expected life, firmware state |
|
Location |
Site, gateway, location, latitude, longitude |
|
Operations |
Owner, state, battery, signal, uptime, criticality, last communication |
|
Links |
Linked native product, sensors, alarms, commands, maintenance |
Industrial machine, robot, PLC controller, sensor, camera, vehicle, generator set, air conditioning, meter, solar panel, wind turbine, pump, motor, conveyor, scale, tank, connected door, lock, lighting and weather station.
Sensors are attached to devices and produce the time series that feed every KPI, chart and AI analysis.
|
Quantity |
Default unit |
Quantity |
Default unit |
|
Temperature |
degC |
GPS |
deg |
|
Humidity |
pct |
Accelerometer |
g |
|
Pressure |
bar |
Light |
lux |
|
Vibration |
mm/s |
Noise |
dB |
|
Level |
pct |
Air quality |
AQI |
|
Flow |
m3/h |
Water |
m3 |
|
Energy |
kWh |
PH |
pH |
|
Current |
A |
Conductivity |
uS/cm |
|
Voltage |
V |
Weight |
kg |
|
Gas / CO2 |
ppm |
|
|
Each reading stores a value, a unit, a date and time, a quality flag (good, uncertain, bad), a status and an anomaly flag. Low and high thresholds drive alarm generation; sample rate and precision are configurable per sensor.
The collection engine provides streaming, historisation, compression, aggregation, filtering and validation.
· Live stream — the latest readings, timestamped, with device, sensor type and value; anomalies highlighted.
· Threshold monitoring — any reading above its high threshold is rendered in red.
· Throughput — MQTT messages per minute aggregated across online gateways.
· Auto refresh — optional 30-second refresh for supervision-room use.
· Mapping — GPS position of sites and devices, colour-coded by state, red when an alarm is active.
Each critical asset owns a digital twin: a live numeric mirror of the physical equipment.
· 3D view — viewport for the asset model; each twin references its own glTF model URL (architecture ready).
· Real-time state and consolidated health score.
· Variables — temperature, vibration, power, cycle time, cycles and run hours, specific to each asset.
· KPIs — OEE and availability gauges when the twin is bound to a machine.
· Context — active alarms, pending maintenance, synchronisation state and documentation (plans, photos, manuals).
The predictive engine anticipates failures from collected data and turns them into planned work.
|
Indicator |
Meaning |
|
Failure probability |
Likelihood of the failure mode occurring within the horizon |
|
RUL (remaining useful life) |
Estimated remaining life in days |
|
MTBF |
Mean time between failures (hours) |
|
MTTR |
Mean time to repair (hours) |
|
Health index |
Consolidated asset condition (0–100) |
|
Predicted date |
Date the failure is expected |
|
Cost estimate |
Estimated cost of the intervention |
|
Recommendation |
Actionable text for the maintenance team |
The AI assistant answers natural-language questions against the live IoT data of the instance.
Example: "Why is machine M-205 consuming 20 percent more this week?" — the assistant returns an argued conclusion, a quantified recommendation, a confidence level and the device concerned.
· Anomaly detection
· Failure prediction
· Consumption optimisation
· Alarm explanation
· Report generation
· Performance comparison
· Action suggestion
Isolation Forest, LSTM with Weibull survival analysis, Prophet, gradient boosting, linear programming, decision tree with SHAP attribution, Kolmogorov-Smirnov drift test and ADEME emission factors.
A REST API exposes the whole module to third-party systems.
|
Method |
Endpoint |
Purpose |
Scope |
|
POST |
/devices |
Add a connected device |
device:write |
|
GET |
/devices |
List devices |
device:read |
|
GET |
/devices/{id} |
Read one device |
device:read |
|
PUT |
/devices/{id} |
Change device parameters |
device:write |
|
POST |
/measures |
Send sensor data (ingestion) |
sensor:write |
|
GET |
/measures |
Read measures |
sensor:read |
|
GET |
/sensors/{id}/history |
Read a sensor history |
sensor:read |
|
POST |
/commands |
Trigger a remote command |
command:write |
|
GET |
/commands/{id} |
Read command state |
command:read |
|
GET |
/alarms |
List active alarms |
alarm:read |
|
POST |
/alarms/{id}/ack |
Acknowledge an alarm |
alarm:write |
|
GET |
/machines |
Read machines and OEE |
machine:read |
|
GET |
/energy |
Read energy consumption |
energy:read |
|
GET |
/maintenance |
Read maintenance predictions |
maintenance:read |
· Users and roles — 11 permission groups (devices, sensors, machines, network, alarms, commands, maintenance, energy, AI, API, reporting), each with read / write / delete, plus an administration right.
· TLS encryption — TLS 1.3 on MQTTS, HTTPS and OPC-UA.
· JWT authentication and scoped API keys.
· Certificate management — client certificates (mTLS).
· Rate limiting per key and IP whitelisting.
· Audit — timestamped security log: logins, commands, API keys, configuration changes, authentication failures, firmware deployments and physical access.
· History — every command and alarm is retained with its author and timing.
|
Group |
Read |
Write |
Delete |
Covers |
|
device |
yes |
yes |
yes |
Sites, devices, device types, firmware, twins |
|
sensor |
yes |
yes |
yes |
Sensors and measures |
|
machine |
yes |
yes |
yes |
Machines and PLC controllers |
|
network |
yes |
yes |
yes |
Gateways, networks, protocols |
|
alarm |
yes |
yes |
yes |
Alarms and alarm rules |
|
command |
yes |
yes |
yes |
Remote commands and automation |
|
maintenance |
yes |
yes |
yes |
Predictive maintenance |
|
energy |
yes |
yes |
yes |
Energy and consumption |
|
ai |
yes |
yes |
yes |
AI analyses |
|
api |
yes |
yes |
yes |
API keys and audit log |
|
reporting |
yes |
— |
— |
Reporting only |
|
Item |
Value |
|
Dolibarr |
16.0 or higher (validated on 17.0.3) |
|
PHP |
7.1 minimum, fully compatible with PHP 8.x |
|
Database |
MySQL / MariaDB or PostgreSQL |
|
Module number |
517200 (unique, collision-checked) |
|
Rights class |
iotmanager |
|
Family |
IoT & Industry 4.0 |
|
Dependencies |
modSociete, modProduct |
|
Licence |
GPL v3 |
|
Publisher |
DoliResources — www.doliresources.com |
· Native Dolibarr architecture — every object extends CommonObject, uses the standard fields array, entity management (multi-company), triggers-ready create/update/delete and the standard rights system.
· Object-oriented — one class per business object, a shared registry, and generic list/card engines.
· Schema self-healing — on activation the module ALTERs in any column added by a newer version, because Dolibarr only ever runs CREATE TABLE.
· Responsive design — CSS grid and flexbox layouts adapt from desktop to tablet.
· Performance — indexed foreign keys, scalar aggregate queries, paginated lists and bounded result sets.
· Security — CSRF tokens on every state-changing action, prepared escaping on all input, per-group permission checks on every page.
· Internationalisation — the native Dolibarr translation system, with module-unique key prefixes so labels never collide with another module's translations.
The module ships complete translations in French, English, Spanish, Italian and German (512 keys per language).
A realistic, FK-coherent demonstration dataset is generated on first activation and can be reinstalled or removed at any time from the setup page. It is versioned, so an upgrade refreshes it.
|
Object |
Rows |
Object |
Rows |
|
Sites |
6 |
Alarms |
26 |
|
Gateways |
7 |
Alarm rules |
10 |
|
Device types |
20 |
Commands |
24 |
|
Devices |
32 |
Automations |
10 |
|
Sensors |
64 |
Digital twins |
8 |
|
Measures |
650 |
Maintenance |
12 |
|
Machines |
10 |
Energy records |
36 |
|
PLC controllers |
6 |
AI analyses |
10 |
|
Networks |
5 |
API keys |
6 |
|
Protocols |
17 |
Audit events |
20 |
|
Firmware |
8 |
Third parties |
6 |
Ten cross-functional reports combine an interactive chart with a detailed table, and export to PDF, Excel, CSV and Word, or print directly.
|
Report |
Content |
|
Global IoT |
Full device inventory with state, battery, signal, uptime and criticality |
|
Machines |
OEE, availability, performance, quality, produced and rejected parts, run/stop hours |
|
Sensors |
Type, unit, last/min/max value, high threshold, quality and reading count |
|
Consumption |
Consumption, unit, peak, unit cost, total cost, CO2, efficiency and variation |
|
Maintenance |
Failure mode, probability, RUL, MTBF, MTTR, health index, predicted date and cost |
|
Availability |
Per-site device count, online, offline and average uptime |
|
Alarms |
Severity, trigger, device, message, timing, duration and state |
|
OEE |
OEE breakdown by machine and production line |
|
Energy |
Energy records by fluid and period |
|
AI |
Analysis type, algorithm, confidence, score and conclusion |
© 2026 DoliResources — IoT Manager Enterprise 1.0.0 — www.doliresources.com


