
Discover powerful Dolibarr extensions designed to automate your business processes
Digital Twin Manager turns Dolibarr into a full Enterprise Digital Twin Management Platform. It lets an organisation model, supervise, analyse, simulate and optimise...
Couldn't load pickup availability


Digital Twin Manager turns Dolibarr into a full Enterprise Digital Twin Management Platform. It lets an organisation model, supervise, analyse, simulate and optimise its real physical assets directly inside Dolibarr, with no external digital-twin platform required.
The module is layered as follows:
|
Layer |
Responsibility |
|
Digital Twin Core Engine |
Digital twins, real/virtual asset relation, lifecycle, history, versioning, metadata |
|
Asset Management Layer |
Machines, facilities, equipment, sites, buildings, vehicles, networks |
|
3D Visualization Engine |
Models, virtual scenes, interactive objects, dynamic states |
|
BIM Integration Layer |
IFC, Revit, BIM 360, CAD models, technical drawings |
|
IoT Data Layer |
Sensors, connected machines, PLCs, gateways, real-time streams |
|
Analytics Layer |
KPIs, history, trends, predictive analysis |
The module ships 22 business objects, each with its own table, list, card, search filters and column selector.
|
Object |
Table |
Purpose |
|
dtmsite |
llx_dtm_site |
Physical site / facility with GPS coordinates |
|
dtmasset |
llx_dtm_asset |
Physical asset (hub) |
|
dtmlifecycle |
llx_dtm_lifecycle |
Asset lifecycle event |
|
dtmtwin |
llx_dtm_twin |
Digital twin (hub) |
|
dtmtwinversion |
llx_dtm_twin_version |
Twin version / revision |
|
dtmmodel3d |
llx_dtm_model3d |
3D model |
|
dtmbim |
llx_dtm_bim |
BIM model |
|
dtmbimobject |
llx_dtm_bim_object |
IFC element |
|
dtmconnector |
llx_dtm_connector |
IoT connector / gateway |
|
dtmsensor |
llx_dtm_sensor |
IoT sensor (hub) |
|
dtmmeasure |
llx_dtm_measure |
IoT measure / telemetry |
|
dtmsimulation |
llx_dtm_simulation |
Simulation run (hub) |
|
dtmscenario |
llx_dtm_scenario |
What-if scenario |
|
dtmscenariovar |
llx_dtm_scenario_var |
Scenario variable |
|
dtmprediction |
llx_dtm_prediction |
AI prediction |
|
dtmanomaly |
llx_dtm_anomaly |
Detected anomaly |
|
dtmmaintenance |
llx_dtm_maintenance |
Predictive maintenance work order |
|
dtmalert |
llx_dtm_alert |
Alert |
|
dtmkpi |
llx_dtm_kpi |
KPI definition and value |
|
dtmautomation |
llx_dtm_automation |
IF/THEN automation rule |
|
dtmworkflow |
llx_dtm_workflow |
BPMN workflow |
|
dtmdocument |
llx_dtm_document |
Technical document |
The module builds on native Dolibarr objects: Third parties, Products, Stocks, Warehouses, Projects, Users and Agenda. Assets can be linked to a Dolibarr product, sites to a third party, and twins to a project. It is designed to sit alongside the Dolibarr innovation modules (IoT Manager, Business Intelligence, API Manager, BPMN Workflow, Intelligent OCR, ESG).
|
Area |
Capability |
|
Digital twins |
Creation, versioning, lifecycle, sync state, health score, model fidelity, real-time variables |
|
Physical assets |
Machines, plants, buildings, warehouses, energy facilities, vehicles, infrastructure, technical networks, farming and medical equipment |
|
Asset lifecycle |
Acquisition, installation, operation, maintenance, modification, decommissioning, replacement |
|
Sites |
GPS-located sites with surface, manager, third party and asset count |
|
3D models |
OBJ, FBX, GLTF, GLB and IFC models with a native interactive viewer |
|
BIM |
IFC (IFC2X3 / IFC4), Revit and BIM 360 import, IFC property reading, equipment linking |
|
IoT |
MQTT, REST API, OPC-UA, Modbus and LoRaWAN connectors, sensors and telemetry |
|
Mapping |
Interactive GPS map with state colouring, search and filtering |
|
Simulation |
Real-time what-if engine, scenarios, parametric variables, physics domains |
|
AI |
Failure prediction, anomaly detection, recommendations, optimisation |
|
Predictive maintenance |
Predictive/preventive/corrective/conditional work orders, MTBF, MTTR, availability |
|
Automation |
IF/THEN rules, BPMN workflows, multi-level alerts |
|
Reporting |
Six decisional reports with CSV export, KPI library |
|
API |
REST API for twins, assets, sensors, measures, alerts, predictions and KPIs |
The dashboard is the entry point of the platform and provides five views over the whole estate.
· Global view: digital twins, connected assets, supervised sites, active sensors, average asset health, global availability, measures today and simulations run.
· Real-time view: SCADA tiles showing each sensor's latest value with a live pulse indicator; the value turns orange near the high threshold and red beyond it.
· Asset states: equipment split by operating state (running, idle, degraded, fault, under maintenance, offline) with the average health of each group.
· Alarms & anomalies and Maintenance & reliability: active and critical alarms, open anomalies, assets at risk, planned and overdue maintenance, failures predicted within 30 days, average MTBF/MTTR and energy consumption.
· Analytics: six decisional charts (equipment states, monthly energy, availability by site, alerts by level, maintenance cost, twins by type).
A digital twin is the virtual representation of a real physical asset. It carries its own identification, its physical relation, its technical data, its operational state and its documentation.
· Identification: reference, name, type, category, version.
· Physical relation: real asset, site, third party and Dolibarr project.
· Technical data: manufacturer, model, serial number, manufacture and installation dates, lifespan.
· Operational data: current state, sync state, health score, model fidelity, real-time variables and history.
· Versioning: every twin keeps a full revision history with author and changelog; the current version is flagged.
Assets are classified as industrial, real estate, logistics, energy, agricultural, medical, transport or technical network, and carry a criticality (low, medium, high, vital). The full lifecycle is tracked: acquisition, installation, operation, maintenance, modification, decommissioning and replacement.
The viewer renders the asset scene natively inside the module. No external 3D library or CDN is required, so it works in an offline or locked-down Dolibarr instance.
· Navigation: drag to rotate, scroll to zoom, click an object to select it.
· Controls: reset view, auto-rotate and wireframe mode.
· The asset sensors appear as selectable objects in the scene; their colour reflects the sensor state and selecting one shows its latest reading.
· Supported model formats: OBJ, FBX, GLTF, GLB and IFC.
The BIM layer imports IFC models (IFC2X3, IFC4) produced by Revit, ArchiCAD or BIM 360, reads their properties and exposes the building structure by storey and space.
· Each IFC element carries its GUID, IFC class, storey, space and property set.
· An IFC element can be linked to a physical asset, which is what connects the BIM model to the digital twin and its live sensors.
· Global indicators: number of models, elements, gross area and linked equipment.
IoT Connect supervises the telemetry flowing into the twins.
|
Protocol |
Typical use |
|
MQTT |
Plant gateways and broker topics |
|
REST API |
SCADA and third-party platform polling |
|
OPC-UA |
Industrial PLC and machine servers |
|
Modbus |
TCP holding registers on electrical and HVAC equipment |
|
LoRaWAN |
Long-range, low-power field sensors |
· Sensor types: temperature, vibration, pressure, energy, production, humidity, rotation, level.
· Each sensor carries min/max thresholds, sampling rate, state and battery level; a reading outside its thresholds is flagged as an anomaly.
· Connector health: endpoint, port, topic, auth mode, poll interval, messages received and last contact.
All sites are located by GPS on an interactive map rendered without any external tile server, so it also works offline. A site is coloured by the worst state among its assets, so a site with a faulty machine reads red at a glance. Search by name or town and filter by state are available.
The what-if simulator estimates the impact of a change on the asset in real time. The behavioural model is explicit and deterministic: each physical variable contributes a documented penalty, so the estimate is explainable and reproducible rather than a black box.
|
Input |
Effect on the estimate |
|
Machine load (%) |
Penalises health above 80 %; drives energy quadratically |
|
Temperature (°C) |
Penalises health above 60 °C; adds thermal compensation to energy |
|
Production rate (u/h) |
Adds a linear term to energy consumption |
|
Vibration (mm/s) |
Penalises health above 4 mm/s; amplifies failure risk above 6 mm/s |
· Outputs: estimated health, energy, wear per 1 000 hours and failure risk, plus a synthesis sentence.
· Scenario library: production increase, compressor failure, heatwave, deferred maintenance, energy reduction, grid outage, vibration drift and more.
· Physics domains: thermal, mechanical, energy and flow. Simulation runs store their input parameters and results as JSON, consumable by an external system through the API.
The AI assistant analyses asset state, detects anomalies, predicts failures and issues recommendations. Every recommendation is computed from the live twin data, so it stays traceable back to the records that produced it.
· Failure prediction: probability, confidence, horizon and predicted date per asset, computed by Random Forest, LSTM, Gradient Boosting, Isolation Forest or ARIMA models.
· Anomaly detection: threshold, drift, spike, pattern and silence anomalies, with measured vs expected value, deviation and root cause.
· Health analysis: assets whose health drops below the configured threshold are surfaced with a colour-coded severity.
· Predictive maintenance: work orders derived from predictions, with MTBF, MTTR, downtime and cost.
Automation rules follow an IF condition THEN action pattern, for example: IF temperature > 85 °C FOR 5 min THEN raise alert.
· Trigger events: sensor threshold, anomaly detected, critical alert, sensor silence, high prediction, unacknowledged alert, schedule.
· Actions: send alert, send email, create intervention, stop asset, plan maintenance, escalate, generate report.
· BPMN workflows model the business chain, e.g. Anomaly detected → Create intervention → Manager approval → Maintenance → Final report.
· Alerts are levelled (information, major, critical) and delivered through Dolibarr, email or API, with acknowledgement tracking.
The module exposes a REST API under /api/index.php/digitaltwinmanager. It requires the Dolibarr API module to be enabled. Authentication uses the standard Dolibarr API key passed in the DOLAPIKEY header.
|
Method |
Path |
Description |
|
GET |
/twins |
List digital twins (sqlfilters, limit, page) |
|
GET |
/twins/{id} |
Read one digital twin |
|
POST |
/twins |
Create a digital twin |
|
PUT |
/twins/{id} |
Update a digital twin |
|
DELETE |
/twins/{id} |
Delete a digital twin |
|
GET |
/twins/{id}/state |
Read the current state and real-time variables |
|
PUT |
/twins/{id}/state |
Update the twin state from an external system |
|
GET |
/twins/{id}/history |
Read the measure history of a twin |
|
GET |
/assets |
List physical assets |
|
GET |
/assets/{id} |
Read one physical asset |
|
POST |
/assets |
Create a physical asset |
|
GET |
/sensors |
List IoT sensors |
|
POST |
/measures |
Push an IoT measure onto a sensor |
|
GET |
/measures |
Read IoT measures |
|
GET |
/alerts |
List alerts |
|
GET |
/predictions |
List AI predictions |
|
GET |
/kpis |
Read computed KPI indicators |
Push an IoT measure onto sensor 12:
curl -X POST 'https://<host>/api/index.php/digitaltwinmanager/measures' \
-H 'DOLAPIKEY: <your-key>' -H 'Content-Type: application/json' \
-d '{"fk_sensor":12,"measure_value":78.4,"unit":"degC"}'
A measure pushed through the API automatically refreshes the sensor's last value and flags the reading as an anomaly when it falls outside the configured thresholds, keeping the twin coherent.
The module declares 23 rights across eight groups. Read and write are granted by default on activation so the module is immediately usable; delete and admin are not.
|
Group |
Scope |
Read |
Write |
Delete |
|
twin |
Digital twins, versions, documents |
yes |
yes |
no |
|
asset |
Physical assets, lifecycle, sites |
yes |
yes |
no |
|
model |
3D models, BIM models and objects |
yes |
yes |
no |
|
iot |
Connectors, sensors, measures |
yes |
yes |
no |
|
simulation |
Simulations, scenarios, variables |
yes |
yes |
no |
|
ai |
Predictions, anomalies, maintenance |
yes |
yes |
no |
|
automation |
Alerts, rules, workflows |
yes |
yes |
no |
|
reporting |
KPIs, reports, API |
yes |
- |
- |
· Every page and every API route checks the matching right before any data access.
· All SQL values are escaped; API sort fields are validated against the physical columns.
· Dolibarr CSRF tokens protect create, update and delete actions.
· API access uses the Dolibarr API key: an invalid key returns 401, a key without the required right returns 403.
· Data is partitioned by entity, so the module is multi-company safe.
· Audit trail: every record stores its author, creation timestamp and last modification.
1. Copy the digitaltwinmanager folder into the custom/ directory of your Dolibarr installation, or deploy module_digitaltwinmanager-1.0.zip from Home → Setup → Modules → Deploy external module.
2. Go to Home → Setup → Modules, find Digital Twin Manager and enable it.
3. On activation the module creates its 22 tables, 33 menu entries and 23 rights, and seeds a complete demonstration dataset.
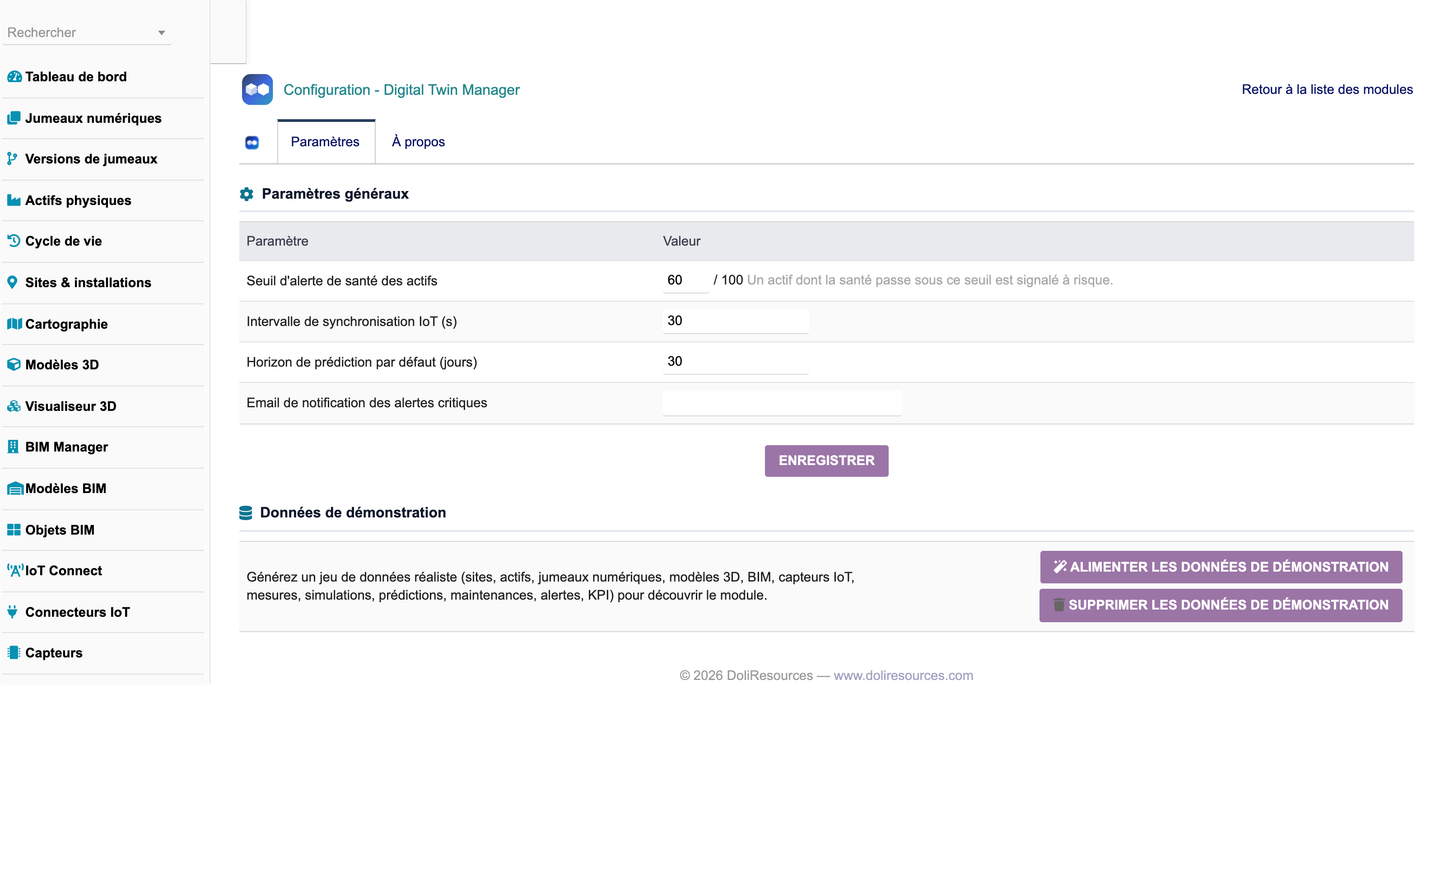
4. Open Digital Twin → Setup to tune the parameters below.
|
Parameter |
Description |
Default |
|
Asset health alert threshold |
An asset whose health drops below this is flagged at risk |
60 / 100 |
|
IoT sync interval |
Connector polling frequency, in seconds |
30 |
|
Default prediction horizon |
Reach of AI predictions, in days |
30 |
|
Critical alert email |
Recipient of critical alert notifications |
(empty) |
The Install demo data button generates a complete, FK-coherent dataset (sites, assets, twins, 3D models, BIM models, IoT sensors, telemetry, simulations, predictions, maintenance, alerts, KPIs). The Remove demo data button deletes only the demonstration records, identified by a dedicated import key, and never touches real data.
|
Requirement |
Value |
|
Dolibarr |
16.0 minimum |
|
PHP |
7.1 minimum (PHP 8 compatible) |
|
Required modules |
Third parties (modSociete), Products (modProduct) |
|
Optional module |
REST API (for the Digital Twin API) |
|
Languages |
French, English, Spanish, Italian, German |
|
Item |
Value |
|
Publisher |
DoliResources |
|
Website |
www.doliresources.com |
|
Module |
Digital Twin Manager 1.0 |
|
Module number |
517400 |
|
Licence |
GNU GPL v3 |
© 2026 DoliResources — www.doliresources.com. All trademarks cited belong to their respective owners.


