
Discover powerful Dolibarr extensions designed to automate your business processes


Business Intelligence Enterprise turns Dolibarr into a full enterprise decision-support platform — an integrated alternative to Microsoft Power BI, Tableau, Qlik Sense, SAP Analytics Cloud, IBM Cognos, Oracle Analytics, Looker, Metabase, Apache Superset, Grafana, Pentaho and Sisense — without leaving the ERP.
The module covers the entire Business Intelligence lifecycle:
Collection → Centralisation → Transformation (ETL) → Modeling → Multidimensional analysis (OLAP) → Dashboarding → Data visualization → Reporting → Forecasting → Alerting → Decision AI.
The executive cockpit above aggregates the whole platform on a single page: 16 premium KPI cards, RAG target-achievement bullets per business domain, revenue trend against target, forecasts, active alerts, AI insights, ESG indicators, a 12-month activity heatmap, geographic breakdown, ETL pipeline health and an audited event timeline.
· Strategic steering — revenue, result, margin, profitability, forecasts, strategic KPIs.
· Operational steering — sales, purchasing, inventory, production, logistics, quality, maintenance, projects.
· Financial steering — cash, accounting, receivables, payables, cash flow, budget.
· Sales & CRM analysis — targets, conversion, pipeline, customer 360, rep performance.
· HR analysis — headcount, leave, recruitment, training, performance.
· ESG / CSR analysis — CO2 scopes 1/2/3, energy, water, waste, safety, diversity.
The module follows native Dolibarr architecture end to end: CommonObject-based business classes, a descriptor-driven module definition, standard permissions, MultiCompany/MultiEntity awareness through getEntity(), and the native translation system.
|
Layer |
Role |
Objects |
|
Data sources |
Connect native and external systems |
biedatasource |
|
Data sets |
Scope an analytical perimeter and its fields |
biedataset, biedatasetfield |
|
Data Warehouse |
Persist facts, dimensions and aggregates |
biewarehouse |
|
ETL |
Extract, transform and load into the warehouse |
bieetljob, bieetlstep |
|
Semantic model |
Relate data sets; define dimensions and measures |
biemodel, bierelation, biedimension, biemeasure |
|
KPI engine |
Define, target, threshold and historise indicators |
biekpi, biekpivalue |
|
Visualization |
Compose dashboards, widgets and charts |
biedashboard, biewidget, biechart |
|
Analysis |
OLAP pivot and data discovery |
bieanalysis, bieexploration |
|
Predictive & AI |
Forecast, detect anomalies, recommend |
bieforecast, bieaiinsight |
|
Delivery |
Alert, report, schedule, share |
biealert, biereport, bieschedule, bieshare |
|
Governance |
Audit trail and programmatic access |
bieaudit, bieapikey |
· 25 tables prefixed llx_bie_*, each carrying entity, status, date_creation, tms, fk_user_creat, fk_user_modif and import_key.
· Every foreign key is indexed; index names are kept short to stay under the 64-character limit.
· A schema self-heal (bieEnsureSchema) runs at activation and ALTERs in any column added by a later version — Dolibarr only ever runs CREATE TABLE, never ALTER.
· table_element carries no llx_ prefix; the SQL files keep the literal llx_bie_* names.
Native: Dolibarr database, MultiCompany, MultiEntity. External (architecture in place): MySQL, MariaDB, PostgreSQL, SQL Server, Oracle, CSV, Excel, REST API, JSON, XML, Google Sheets. Each source declares its connection, authentication, refresh mode (real-time, hourly, daily, weekly, monthly, manual), cron expression, sync history and owner.
The warehouse layer persists fact tables, dimension tables and aggregates with grain, partition key, retention, size, index count and incremental mode. The ETL engine runs Extract → Transform → Load with ordered, typed steps (cleansing, deduplication, mapping, normalisation, calculations) and tracks rows in / out / rejected, duration, run count, error count and last-run status.
Star and snowflake models relate data sets through typed relations (cardinality, join type). Dimensions carry drill hierarchies (e.g. Year > Quarter > Month > Day); measures carry aggregation, formula, unit, format and additivity.
The builder composes dashboards by drag & drop on a 12-column grid. Widgets can be resized, duplicated, deleted and bound to a KPI; the layout is persisted as bie_widget rows.
KPI Card · Gauge · Thermometer · Donut · Pie · Bar · Line · Area · Radar · Waterfall · Funnel · Sankey · Treemap · Heatmap · Scatter · Bubble · Geographic map · Timeline · Data table · Pivot table · Calendar · LED indicator.
Line · Bar · Donut · Radar · Treemap · Sankey · Waterfall · Funnel · Heatmap · Scatter · Bubble · Analytical Gantt · KPI card · Bullet graph · Pareto · Sunburst · Gauge · Timeline · World map · Regional map. All charts are interactive, zoomable, filterable and exportable.
Rendering is native by default (no external dependency). The architecture also accepts Apache ECharts, Chart.js, Highcharts and D3.js, selectable in the setup page.
The module ships a library of 284 ready-to-use indicators across 12 business domains. Each KPI carries a name, description, category, formula, unit, target, minimum and maximum thresholds, owner, calculation frequency, current and previous value, variation, achievement rate and an improvement direction that drives all RAG colouring.
|
Domain |
KPIs |
Examples |
|
Financial |
35 |
Revenue, gross/net margin, EBITDA, cash flow, working capital, ROE, DSO, budget variance |
|
Sales |
30 |
Conversion rate, average order value, new customers, retention, churn, LTV, CAC |
|
CRM |
27 |
Opportunities, pipeline value, win rate, sales cycle, satisfaction, NPS |
|
Human resources |
27 |
Headcount, FTE, turnover, absenteeism, payroll, training hours, time to hire |
|
Purchasing |
20 |
Purchase amount, supplier lead time, on-time delivery, savings, dependency |
|
Inventory |
22 |
Stock value, turnover, days of inventory, stockout rate, service level, shrinkage |
|
Production |
22 |
OEE, availability, performance, quality rate, scrap, cycle time, capacity |
|
Quality |
20 |
Conformity, non-conformities, cost of poor quality, DPMO, Cpk, audits |
|
Logistics |
20 |
Shipments, OTIF, delivery lead time, transport cost, picking productivity |
|
Maintenance |
18 |
MTTR, MTBF, MTTF, availability, preventive ratio, downtime, backlog |
|
ESG / CSR |
21 |
CO2 scopes 1/2/3, carbon intensity, energy, water, waste recovery, safety, pay gap |
|
Projects |
22 |
Completion, budget variance, margin, CPI, SPI, earned value, resource utilisation |
The OLAP page builds a cube from the KPI value history joined to the KPI dimensions, and exposes the five canonical operations.
|
Operation |
Behaviour |
|
Drill down |
Walks down the declared hierarchy (Year > Quarter > Month) |
|
Drill up |
Walks back up to the parent level |
|
Slice |
Restricts the cube to one category |
|
Dice |
Restricts the row dimension with a free filter |
|
Pivot |
Swaps the row and column axes instantly |
Cells are shaded proportionally to their value, so the pivot reads as a heat map; row totals, column totals and the grand total are computed in the same single grouped query. The whole table exports to CSV exactly as displayed.
Security: row/column dimensions, measures and aggregations are resolved through a server-side whitelist — no user input ever reaches the SQL string.
The forecasting engine projects any indicator forward over a configurable horizon.
|
Property |
Description |
|
Algorithms |
Linear regression, moving average, Holt-Winters |
|
Horizon |
Configurable in months (3, 6, 12 …) |
|
History |
Number of historical periods used to fit |
|
Seasonality |
None or monthly |
|
Trend slope |
Fitted slope of the series |
|
R squared |
Coefficient of determination — goodness of fit |
|
MAPE |
Mean absolute percentage error |
|
Confidence |
Confidence percentage and lower/upper bounds |
Forecast targets include revenue, sales, cash, orders, expenses, margin, production, payroll, purchases and stock value.
The decision AI explains indicators, detects anomalies, identifies trends, compares periods, summarises performance and suggests actions — for example answering "Why did sales drop this month?".
The analysis is computed by a deterministic statistical engine — least-squares linear trend plus Z-score anomaly detection — so the page is fully functional with NO external AI provider configured. Every finding and every recommendation is derived from a figure the module actually computes and displays: mean, standard deviation, Z-score, R squared, period-over-period variation and target achievement. The module never states a number it cannot establish.
When a provider is configured (OpenAI, Ollama local, Azure OpenAI, Anthropic, Mistral), the same computed findings are what would be handed to it as grounding context. Stored insights record provider, model, question, finding, recommendation, confidence, estimated impact and token usage.
The reporting page presents the KPI scorecard and drives the report engine.
· Scorecard — reference, label, category, current value, target, variation, RAG achievement bar and an inline SVG sparkline per indicator.
· Category filter — instantly yields the dashboard of a given direction (finance, sales, HR, inventory, production, ESG …).
· CSV export of the whole scorecard, formula included.
· Report designer — custom reports, templates, filters, parameters, calculations, charts and groupings.
· Output formats — PDF, Excel, CSV, Word, PowerPoint, HTML.
· Scheduling — automatic delivery (daily, weekly, monthly, quarterly) to a recipient list.
Performance note: the scorecard loads the full KPI history in a single grouped query and buckets it in memory, so 284 sparklines cost one query rather than 284.
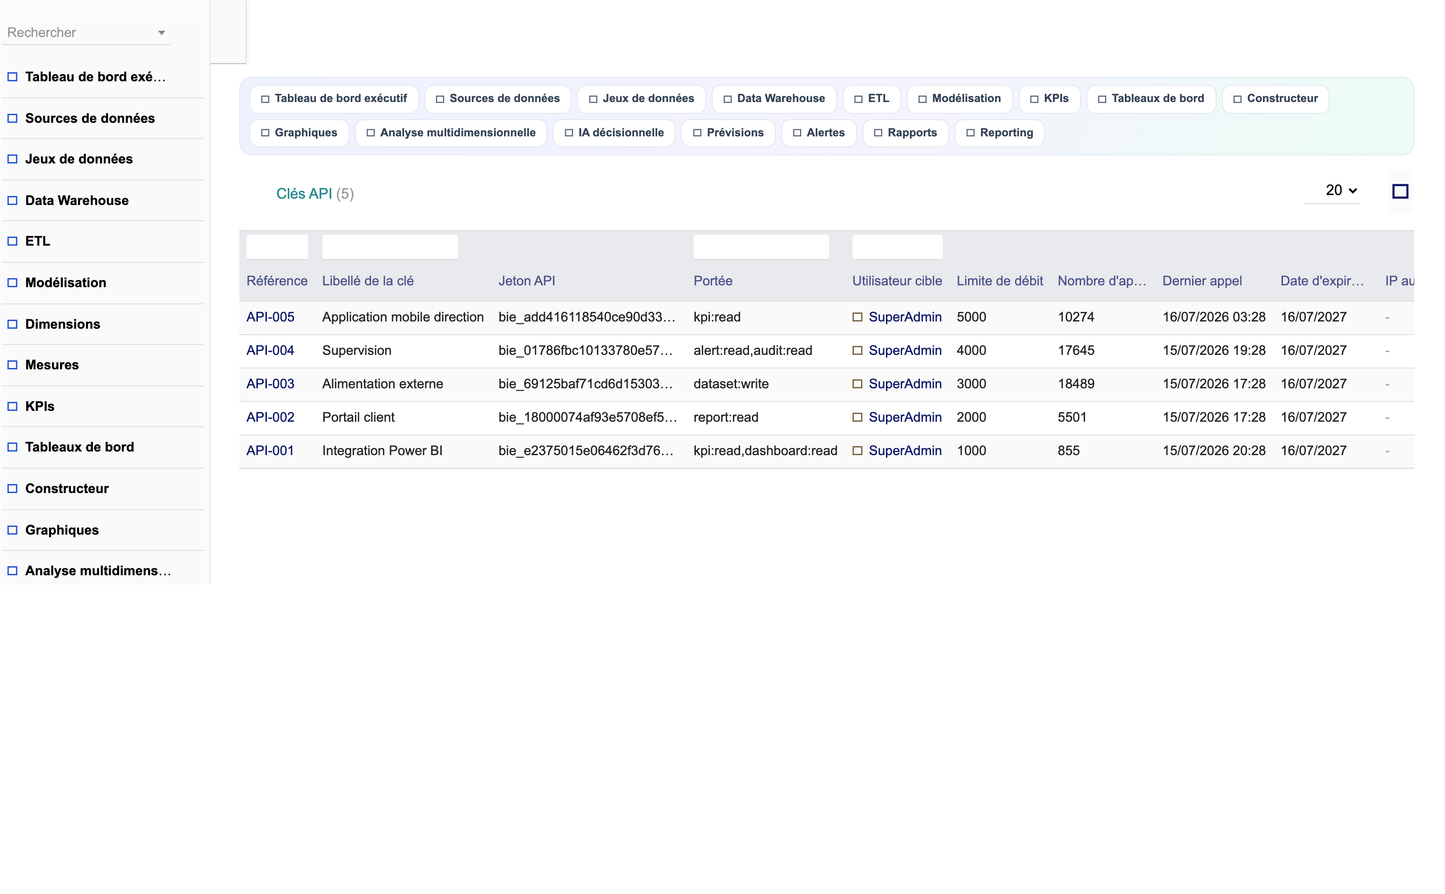
The BI API exposes the platform to external consumers.
|
Property |
Description |
|
Scope |
Restricted scope per key, e.g. kpi:read,dashboard:read |
|
Rate limit |
Per-key call quota |
|
Allowed IPs |
Optional IP restriction |
|
Expiry |
Key expiry date |
|
Usage |
Call counter and last-call timestamp |
|
Capabilities |
Export KPIs and dashboards, read reports, feed data in |
The module reads the native Dolibarr modules through its data sets: CRM, third parties, products, stock, warehouses, purchasing, sales, quotations, orders, invoices, accounting, bank, HR, projects, interventions, production, and integrates alongside the DoliResources GMAO, Facility Management, QHSE, ESG, OCR, e-signature, API Manager, Workflow, GED and AI Assistant modules.
|
Control |
Implementation |
|
Permissions |
45 granular rights across 14 functional groups plus audit, reporting and administration |
|
BI roles |
Read / write / delete per group; read and write granted by default, delete and admin withheld |
|
Audit trail |
Date, event type, object, user, IP, severity, row count, duration |
|
Traceability |
Configurable retention (365 days by default) for GDPR compliance |
|
SQL safety |
OLAP dimensions, measures and aggregations resolved via server-side whitelist |
|
Input safety |
Widget types revalidated against a whitelist on save; all values escaped via the DB layer |
|
Dashboard access |
Private / shared / public-token sharing with fine-grained permissions and expiry |
|
Secrets |
AI and source credentials stored server-side, rendered as password fields |
|
Item |
Value |
|
Module name |
businessintelligence |
|
Descriptor |
modBusinessIntelligence |
|
Module numero |
517100 (rights 517101-517145) |
|
Version |
1.0.0 |
|
Publisher |
DoliResources — www.doliresources.com |
|
Licence |
GPL v3 or later |
|
Dolibarr |
16.0 and above (validated on 17.0.3) |
|
PHP |
7.1 → 8.x |
|
Database |
MySQL / MariaDB; PostgreSQL-compatible architecture |
|
Business objects |
25 |
|
Tables |
25 (llx_bie_*) |
|
Permissions |
45 |
|
Menu entries |
1 top + 25 left |
|
KPI library |
284 across 12 domains |
|
Widget types |
22 |
|
Chart families |
20 |
|
Languages |
French, English, Spanish, Italian, German (531 keys each) |
|
Chart engines |
Native (default); ECharts, Chart.js, Highcharts, D3.js architecture |
|
AI providers |
OpenAI, Ollama, Azure, Anthropic, Mistral (all optional) |
· Object-oriented, CommonObject-derived classes with fetch/fetchAll/create/update/delete and getNomUrl.
· MultiCompany / MultiEntity: every query filters through getEntity().
· Multi-language via the native Dolibarr translation system; the module re-asserts its own labels at render time so that, on an instance running many modules, a shared translation key can never surface another module's wording on a BI screen.
· Multi-currency through the native price() formatter.
· Responsive design; CSS served through a module_parts stylesheet.
· Intelligent caching: configurable dataset cache TTL.
· SQL optimisation: grouped single-pass queries for the pivot, the heatmap and the scorecard sparklines (no N+1).
· Interactive JavaScript is guarded against double-binding (Dolibarr may inject module JS more than once).
· Documented code: file, class and method docblocks throughout.
The architecture is designed to accept future Big Data connectors, external Data Lake / Data Warehouse targets, advanced machine learning and third-party BI platform integration (including Power BI export), without disturbing the existing model.
© 2026 DoliResources — www.doliresources.com


