
Discover powerful Dolibarr extensions designed to automate your business processes
Drip Irrigation Management (technical name irrigationgoutte) turns Dolibarr into a dedicated management tool for localised drip irrigation. It covers the whole chain from the...
Couldn't load pickup availability


Drip Irrigation Management (technical name irrigationgoutte) turns Dolibarr into a dedicated management tool for localised drip irrigation. It covers the whole chain from the water resource to the individual emitter: farms, plots, sectors, crops, water sources, pumping stations, hydraulic networks, filtration, fertigation, drip lines and emitters, sensors and meters, water requirement computation, irrigation programmes and cycles, hydraulic readings, water balances, distribution uniformity, anomalies, maintenance, interventions, spare parts, costs and reporting.
· 70 business objects, each with a list, a card, a creation form and REST access
· 1945 translated strings shipped in French, English, Spanish, Italian and German
· 104 controlled vocabularies covering 857 business codes
· A Hydraulic Control Centre dashboard with a water path synoptic and a composite hydraulic performance score
· A demonstration dataset of about 5900 coherent rows that can be installed and removed in one click
The module is designed so that an irrigation scheme can be planned, executed, measured and improved entirely inside Dolibarr, without a separate specialist application and without any modification of the Dolibarr core.
· Centralise every installation, network and equipment record
· Plan the irrigation season and generate the cycles that implement it
· Measure what was actually applied and compare it with what was needed
· Detect leaks, clogging, pressure drift and equipment failures early
· Keep maintenance, spare parts and intervention costs under control
· Produce the water, energy, agronomic and financial reports the operation is judged on
Access is governed by twelve granular permission groups, so the least privilege actually applicable to each role can be granted.
· Farm director, agricultural manager, irrigation manager
· Agronomist, hydraulic engineer, irrigation technician, crop manager
· Maintenance manager, electromechanical technician, pumping station operator
· Storekeeper, management controller, purchasing manager, sales representative
· Installation contractor, maintenance company, Dolibarr administrator, read-only user
Every farm is a full record linked to a Dolibarr third party, carrying its location, areas, dominant soil, climate, main water source and targets.
· Automatic reference, name, linked third party, owner, operator and manager
· Address, region, country, GPS coordinates and altitude
· Total area, irrigated area, number of plots and number of sectors
· Farm type, climate type, dominant soil, volume and cost targets
· Tabs for plots, sectors, water sources, stations, networks, equipment, programmes, consumption, anomalies, costs and documents
Plots carry the agronomic description the water requirement engine needs.
· Area, irrigated area, GPS position and cartographic polygon
· Altitude, slope, exposure and drainage
· Soil type, texture, depth, pH, salinity, water holding capacity and organic matter
· Current crop, variety, planting date, plant density and growth stage
· Irrigation method, nominal flow, daily water need and target yield
A crop and variety reference feeds the requirement computation and the seasonal plan.
· Family, category, vegetative cycle and development stages
· Crop coefficient per stage, average water requirement, recommended frequency
· Water stress tolerance, salinity tolerance and rooting depth
· Minimum and maximum soil moisture thresholds
· Crop history per plot with volumes, costs and incidents
Boreholes, wells, dams, basins, hill reservoirs, public networks, canals, rivers, springs, recycled and desalinated water are all modelled by the same record.
· Depth, static and dynamic level, nominal and real flow, capacity and current volume
· Water quality, pH, salinity, conductivity, turbidity and temperature
· Abstraction permit reference, expiry date, annual quota and unit cost of water
· History of levels, analyses, abstractions and incidents
· Alerts on low level, quota overrun, insufficient flow, high salinity and permit expiry
The pumping station groups the pumps, the energy supply and the head unit, and is the third stage of the water path synoptic.
· Station type, location, GPS position and commissioning date
· Nominal flow, nominal pressure, installed power and daily capacity
· Energy source, generator set, solar array and solar peak power
· Number of pumps, running hours, manager and next maintenance date
· Per pump: brand, model, serial number, power, flow, head, efficiency, running hours and failure history
The network is modelled hierarchically, from the source down to the emitter.
· Source, station, head unit, main pipe, secondary pipe, sector, sub-sector, drip line, emitter
· Per pipe: type, material, diameter, length, nominal pressure and flow, supplier, installation date, warranty and maintenance dates
· An interactive synoptic showing the state, flow, pressure, volume and open alert count of each stage, with a direct link to the matching records
The irrigation sector is the unit that is actually scheduled and irrigated.
· Plots, crop, area, associated network, main valve, meter and pump
· Planned flow, pressure, duration and theoretical volume
· Number of drip lines, total drip length, number of emitters, emitter spacing and flow
· Distribution uniformity rolled up from the sector's own lines
· Priority, authorised calendar, status and manager
Manual, electric, hydraulic, automatic, remote and scheduled command modes are supported.
· Type, diameter, admissible pressure, command mode, power supply and controller
· Installation date, last opening and closing, cycle counter and communication state
· A dedicated operation log recording every opening, closing, partial opening, flush, test and emergency stop with its operator, reason, command mode and result
Sand, disc, screen, hydrocyclone and combined filtration units are managed with their cleaning regime.
· Capacity, mesh, inlet and outlet pressure, maximum admissible pressure drop
· Cleaning interval, cleaning method and backwash mode
· A cleaning log with differential pressure, duration, water used, consumable and cost
· An alert when the differential pressure passes the configured threshold
The drip line is the physical object the uniformity of the whole scheme depends on.
· Line type: inline, pressure compensating, non compensating, anti siphon, root resistant, subsurface, tape, button dripper and micro sprinkler
· Material, diameter, wall thickness and length
· Number of emitters, emitter spacing, unit flow and theoretical total flow
· Minimum and maximum working pressure, clogging rate and measured uniformity
· Installation date, service life, estimated end of life, supplier, linked Dolibarr product and unit cost
Emitter models are catalogued and linked to the lines that use them.
· Brand, model, type, pressure compensating or not
· Nominal flow, working pressure, spacing and clogging resistance
· Installed count, checked count, defective count and clogging rate
· Sampling campaigns feeding the uniformity computation
Water meters, flow meters, pressure sensors, soil moisture probes, tensiometers, weather stations, rain gauges, temperature, conductivity, pH, level and energy meters are all supported.
· Communication protocol, measurement frequency, low and high thresholds
· Battery level, last communication, last calibration and next calibration
· Manual entry, bulk entry, CSV import, REST push and automatic retrieval
· An architecture ready for MQTT, HTTP, REST, LoRaWAN, Modbus, GSM, NB-IoT and CSV, with no mandatory dependency on any single IoT vendor
The requirement engine combines the agronomic and the meteorological data available and always leaves the result open to review by an authorised user.
· Crop coefficient, reference evapotranspiration, crop evapotranspiration
· Rainfall, effective rainfall, soil moisture, available water and allowed depletion
· System efficiency, salinity leaching and rooting depth
· Methods: manual entry, fixed volume, volume per hectare, per tree, per plant, ET0 and Kc based, custom model or reuse of a previous programme
· Outputs: daily, weekly and per cycle requirement, gross and net volume, recommended duration and frequency, and the gap against what was actually applied
Programmes describe the intent; cycles record what happened.
· Validity period, frequency, authorised days, start time, planned duration and volume
· Trigger modes: manual, fixed calendar, computed requirement, soil moisture, tensiometric threshold, weather data, manager decision, external API or controller
· Statuses: draft, to validate, validated, active, suspended, finished, cancelled, archived, with duplication, validation, activation, suspension and cycle generation
· Daily, weekly, monthly, per farm, per plot, per sector, per station and per crop calendar views, plus resource and maintenance planning
Each cycle carries the planned figures, the real figures and the gap between them.
· Planned and real dates, durations and volumes
· Average flow, average pressure, energy consumption, water and energy cost
· Station, pump, valve and meter used, operator, start mode and stop mode
· Statuses: planned, ready, started, running, suspended, finished, partially finished, cancelled, failed, in anomaly
· Actions: start, suspend, resume, finish, cancel, correct, duplicate, print, report, raise an intervention, raise an anomaly
A dedicated hydraulic reading is attached to the cycle, several times per run.
· Pressure at the station, at the sector head and at the end of the line
· Instant, average, minimum and maximum flow, and cumulative volume
· Head loss, flow deviation, pressure deviation and hydraulic efficiency
· Regime stability, leak suspicion and clogging suspicion, with configurable thresholds
The balance compares what was needed, what was planned and what was actually applied.
· Per day, week, ten-day period, month, quarter, season and year
· Per farm, plot, sector, crop, campaign and water source
· Theoretical requirement, planned volume, applied volume, rainfall contribution
· Net supply, deficit, excess, estimated losses and irrigation efficiency
· Volume per hectare and water cost, with monthly trend charts
Liquid and soluble fertilisers, acids, pH correctors, cleaning products, trace elements and biostimulants are managed and linked to Dolibarr products where possible.
· Recipes with products, quantities, concentrations, injection order, duration and rinse
· Target pH and target conductivity, precautions and estimated cost
· Executions recording the batch, planned and real quantity, operator, injector, injection duration, measured pH and conductivity, water volume and final rinse
· Optional automatic stock decrement of the products used
Fourteen inspection templates cover the whole installation.
· Emitter flow, network pressure, distribution uniformity, clogging, filtration
· Leak tightness, valves, pumps, meters, probes, pipes, fertigation units, electrical panels and installation safety
· Each inspection carries its protocol, sample size, measurements with their tolerance band, defect count, downtime and next control date
· Results: compliant, compliant with reservation, to be monitored, action required, non compliant, equipment to be stopped
A dedicated wizard computes the indicators the profession is judged on.
· Sector, line, number of measuring points, test duration and working pressure
· Collected volume per point, converted into a flow rate per emitter
· Mean, minimum and maximum flow, coefficient of variation
· Distribution uniformity, emission uniformity, deviation from nominal flow and the proportion of clogged emitters
· An automatic conclusion, a performance class and the recommended actions
Leak detection is always presented as a suspicion, never as a certainty, because it rests on an estimate.
· Gap between the metered flow and the expected flow
· Abnormal volume, pressure drop and irrigation outside the plan
· A meter moving while the valves are closed, and unusual night consumption
· Historical comparison against a configurable threshold
· Each suspicion can be confirmed or rejected, raises an intervention, records the estimated lost volume and values it financially
Twenty-one anomaly types are modelled, from a leak to an energy overconsumption.
· Farm, plot, sector, equipment and cycle concerned
· Type, severity, detection source, measured value and threshold
· Immediate action, responsible user, downtime, lost volume and financial impact
· Statuses: detected, confirmed, assigned, being handled, resolved, to be monitored, closed, rejected
Maintenance plans are generated per equipment type and per trigger.
· Pump inspection, greasing, bearing change, electrical check
· Filter cleaning, backwash, valve checks, pipe flushing, line rinsing
· Anti clogging treatment, sensor calibration, meter calibration, battery checks
· Leak inspection, emitter replacement and solar panel inspection
· Triggers: a date, a frequency, running hours, a pumped volume, a cycle count, a meter reading, a season or a condition
Failures are recorded with their diagnosis, cause and repair.
· Failure code, diagnosis, work performed and result
· Downtime, parts cost, labour cost and total cost
· Link to the anomaly that raised it and to the intervention that closed it
Interventions carry the field work, its cost and its billing status.
· Type, origin, priority, requester, technician and team
· Requested, planned, start and end dates, and effective duration
· Diagnosis, identified cause, work performed and consumed parts
· Parts cost, labour cost, total cost, third party and billable flag
· Statuses from draft to invoiced, and a link to the Dolibarr Interventions module when it is enabled
Emitters, fittings, seals, valves, filters, discs, screens, pipes, gauges, flow meters, probes, cables, fuses, contactors, bearings, oils, cleaning products, fertilisers and acids are all managed through the native Dolibarr products, batches, warehouses and stock.
· Reserve, issue, return and replace a part from an intervention
· Value the consumption and raise a purchase request or a supplier order
· Minimum stock alert on every managed part
Maintenance and service contracts are managed with customers, operators, suppliers, maintenance companies, installers, laboratories and IoT providers.
· Covered installations and equipment, start and end dates, visit frequency
· Service level, response time, inclusions, exclusions and amount
· Billing and renewal, with periodic interventions generated from the contract
· Uses the native Dolibarr Contracts module when it is enabled
For a company that installs or maintains drip systems, the whole commercial chain is linked to the technical records.
· Studies, visits, measurements, estimates, projects and quotations
· Customer orders, supplier orders, deliveries, installation, acceptance and warranty
· A traceability link from the prospect to the installed equipment and its maintenance
Installation, deposit, progress, final, intervention, maintenance, parts and periodic invoices as well as credit notes are produced with the native Dolibarr mechanisms.
· Traceability preserved between quotation, order, project, installation, intervention, contract, invoice and payment
Costs are computed per farm, plot, sector, crop, programme, cycle, station, pump, equipment, intervention, contract and project.
· Categories: water, electricity, fuel, maintenance, labour, parts, consumables, fertigation, depreciation, rental, transport, external services, analyses and IoT communication
· Indicators: total irrigation cost, cost per hectare, cost per cubic metre, energy cost per cubic metre, cost of water losses, cost of anomalies
· Budget against actual, budget variance, margin per intervention, contract and project
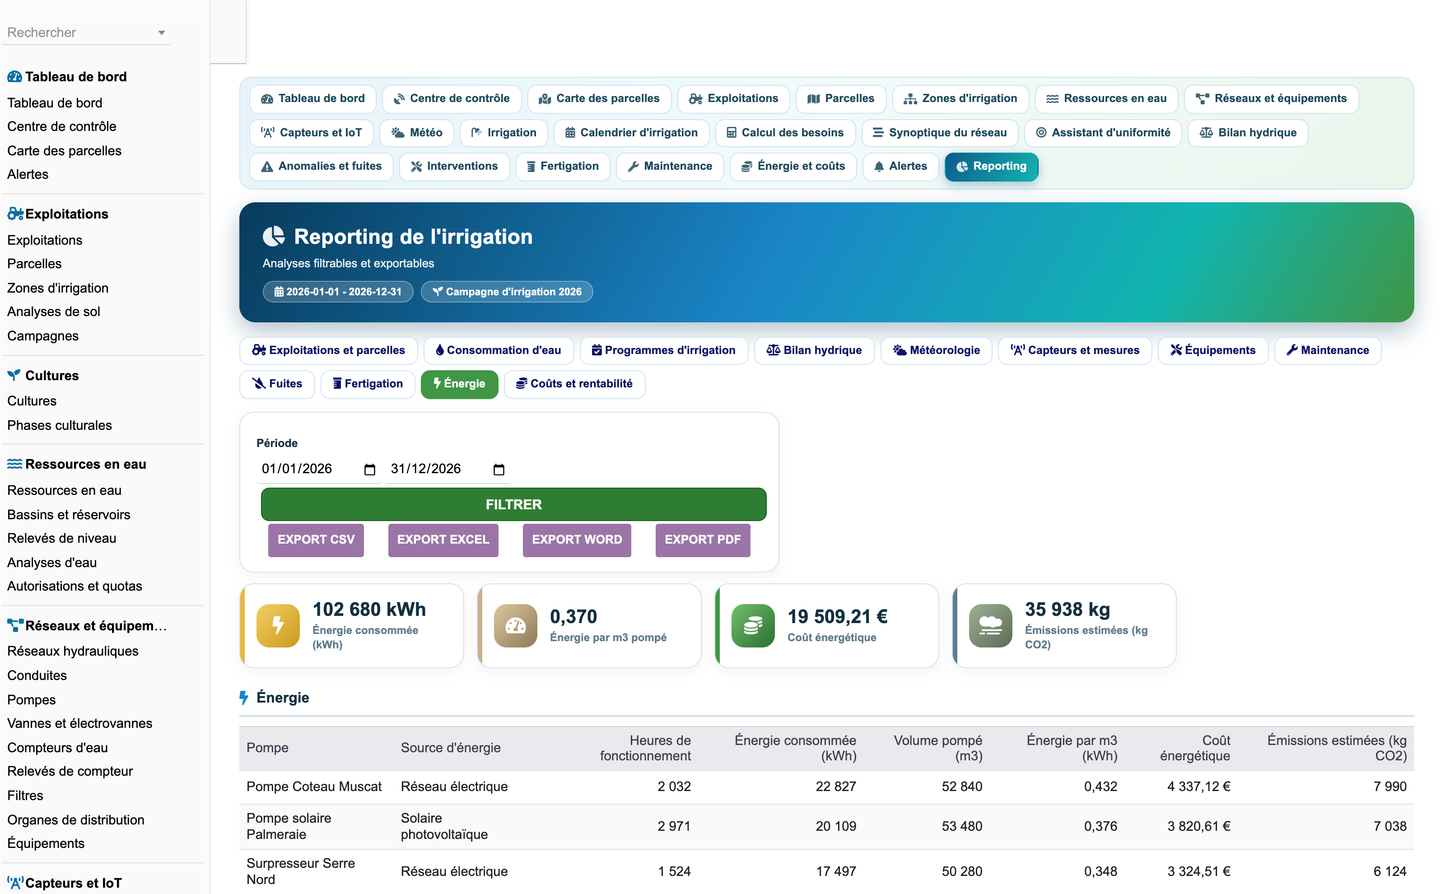
Energy is recorded per station and per pump and related to the volume actually pumped.
· Initial and final meter index, consumption, running time and power
· Cost per kilowatt hour, fuel used, solar energy produced and consumed
· Consumption per cycle, per station and per pump, energy per cubic metre and per hectare
· Monthly trend, station comparison, overconsumption and solar savings
The Hydraulic Control Centre is the entry point of the module.
· A header carrying the farm, campaign, weather, available water, consumption and alerts
· Priority alert tiles that only appear when they actually have a count
· Five gauges: composite hydraulic performance, average uniformity, water efficiency, basin level, soil moisture, quota use and schedule compliance
· The composition of the composite score is printed, never hidden, so an operator can see why the performance reads what it reads
· An interactive water path synoptic from the source to the crop, each stage showing its state, flow, pressure, volume and open alert count
· More than fifty key indicators grouped by domain, and twenty charts
A dedicated reporting menu covers water consumption, hydraulic performance, agronomy, energy, fertigation, maintenance, anomalies and finance.
· Consumption per day, week, month, year, farm, plot, crop, sector, source and campaign
· Planned against actual, unexplained volume and estimated losses
· Flow, pressure, head loss, uniformity, hydraulic efficiency and sector ranking
· Water requirement, deficit, excess, supply per crop and per growth stage
· Exports to PDF, XLSX, CSV, printing, e-mail and chart images
Internal and e-mail notifications are raised on the events that matter and are grouped and acknowledged so they never become noise.
· Cycle to start, late cycle, failed cycle, abnormal pressure or flow
· Suspected leak, filter to clean, pump failure, sensor offline
· Critical water level, excessive consumption, water deficit, over irrigation
· Maintenance due or late, low part stock, permit about to expire, contract to renew
· Configurable recipients, thresholds, frequency, channel, criticality and sending hours
The module follows the Dolibarr security model and never modifies the core.
· Twelve granular permission groups with read, write and delete, plus eight specific rights for validation, execution, reporting, export, demonstration data and administration
· Permissions enforced on every page and on every API route
· CSRF tokens, input validation, HTML escaping and prepared, escaped SQL
· Multi-entity separation honoured on every table and every query
· No password or secret is ever stored in clear text
1945 keys are shipped in five languages and every user visible string goes through the Dolibarr translation system.
· French, English, Spanish, Italian and German
· Menus, buttons, titles, fields, statuses, alerts, messages, errors, documents, reports, settings and visible demonstration data
· Every key is module prefixed, because Dolibarr merges all active modules into a single translation table and an unprefixed key silently shows another module's wording
The module uses only the supported extension mechanisms: hooks, triggers, business classes, extra fields, tabs, menus, API, events and document templates.
· Third parties and contacts, products and services, stock and warehouses
· Quotations, customer orders, supplier orders, shipments and receptions
· Customer and supplier invoices, projects, tasks and time spent
· Interventions, contracts, agenda, document management and accounting
· A feature whose module is disabled is detected, reported and disabled cleanly, never raising a fatal error
A secured REST API exposes every business object of the module.
· GET objects - the machine readable model of all 70 objects and their fields
· GET, POST, PUT and DELETE records/{type} and records/{type}/{id}
· GET dashboard and GET alerts for supervision
· POST measures to push a sensor reading, which updates the sensor last value
· Authentication through the Dolibarr API key; an invalid key returns 401
· Configurable webhooks on programme validated, cycle started, cycle finished, anomaly detected, critical pressure, suspected leak, sensor offline, maintenance created, intervention finished and stock threshold reached
The configuration page carries a Demonstration data tab with two buttons.
· Install builds about 5900 coherent rows across all 70 tables: 2 farms, 8 plots, 12 sectors, 3 water sources, 2 basins, 3 pumping stations, 5 pumps, 4 networks, 48 drip lines, 24 uniformity controls with 384 measuring points, 48 technical inspections, hydraulic readings, water balances, filter cleanings, anomalies, interventions and consumed parts, over twelve months of history
· Remove deletes only what the generator tagged, asks for an explicit confirmation, checks the permission, cascades to the children, reports the number of deleted objects and logs the operation
· Real data is never touched
The module installs like any Dolibarr external module.
· Home, Setup, Modules and Applications, Deploy or install an external module
· Upload module_irrigationgoutte-1.0.zip and enable Drip Irrigation Management
· The 70 tables, 44 permissions and 86 menu entries are created on activation
· The schema self-heals on upgrade, since Dolibarr only ever creates tables and never alters them
· Requires Dolibarr 16 or later, PHP 8.x, MariaDB or MySQL
The code follows the Dolibarr conventions throughout.
· Business classes extending CommonObject, one table per object, prefix llx_irrigationgoutte_
· Standard columns rowid, entity, ref, label, status, date_creation, tms, fk_user_creat, fk_user_modif, import_key, note
· Foreign key indexes and multi-entity support on every table
· A generic list and card engine, a shared vocabulary renderer emitted from a single source, and a scheduled task for the daily checks
· No modification of the Dolibarr core anywhere
· Publisher: DoliResources
· Website: www.doliresources.com
· Author: DoliResources
· Version: 1.0
· Technical name: irrigationgoutte
· Module key: IRRIGATIONGOUTTE
· Developed and copyrighted by DoliResources - www.doliresources.com
Developed and copyrighted by DoliResources - www.doliresources.com
This document and the module it describes are the property of DoliResources. Dolibarr is a registered trademark of the Dolibarr Foundation; this module is an independent external module and does not modify the Dolibarr core.


