
Discover powerful Dolibarr extensions designed to automate your business processes
Household Consumption Management turns Dolibarr into an intelligent, fintech-grade platform to track, analyse and optimise the spending and consumption of one or several...
Couldn't load pickup availability


Household Consumption Management turns Dolibarr into an intelligent, fintech-grade platform to track, analyse and optimise the spending and consumption of one or several households. It brings together, in a single premium interface, everything a family needs to master its budget: daily expenses, income, category budgets, energy and utility consumption, domestic bills, subscriptions, financial goals, alerts, forecasts and money-saving recommendations.
The module is designed around three principles:
· Smart & visual — a modern smart-home / fintech dashboard with live KPIs and charts, so household finances can be understood at a glance.
· Native-first — it relies entirely on Dolibarr's native modules (third parties, invoices, bank, accounting, projects, agenda, document management, contracts, REST API) and never duplicates existing functionality.
· Ready to use — read/write permissions are granted on activation and a complete demonstration dataset is generated automatically, so the module can be explored immediately.
The application is fully multi-household, multi-company and multi-entity, and is available in five languages: French, English, Spanish, Italian and German.
The dashboard is an entirely new, purpose-built cockpit (it does not reuse the standard Dolibarr home page). Its smart-home / fintech charter combines deep finance blue, finance green, alert orange, analytics violet and light greys. It is organised in six thematic zones.
· Total monthly income and total monthly expenses
· Net balance of the month (income minus expenses)
· Savings rate (%)
· Remaining budget
· Annual expenses
· Monthly energy expenses
· Active subscriptions and their monthly / annual cost
· Unread alerts, potential savings and next-month forecast
· Expenses by category — a doughnut chart of spending across the 13 categories.
· Income vs Expenses — a 12-month combined bar-and-line chart.
· Budget vs Actual — per-category progress bars with usage badges highlighting overruns.
· Energy consumption — a breakdown of utility cost by energy type (electricity, water, gas, heating).
· Alert tiles — unread alerts, potential savings, tracked households and a shortcut to the analysis view.
The module extends Dolibarr rather than replacing its features. It integrates with, and reuses, the following native modules:
· Third parties — energy, telecom, food and other suppliers are stored as native Dolibarr companies.
· Supplier & customer invoices — domestic bills can be backed by native supplier invoices; the demo seeder creates native supplier invoices when the module is enabled.
· Products / services — subscriptions and recurring services.
· Bank & treasury, Accounting — payments and financial follow-up.
· Projects, Agenda — planning and scheduling.
· Document management (ECM) — attaching bills and supporting documents.
· Contracts — recurring commitments.
· REST API & Notifications — automation and integration.
A household (foyer) is the central hub object. It records the household name, address, housing type, surface area, number of members, monthly income, monthly budget, savings target and currency, and can be linked to a native third party.
Each household card is a hub: a cockpit summarises the number of members, monthly income, monthly budget and annual expenses. A “Linked records” panel lists every related object (members, expenses, income, budgets, subscriptions, readings, bills, goals, alerts) with one-click “Add” buttons that pre-fill the relationship, making data entry fast.
Members belong to a household and carry a role (parent, child, etc.), birth year, dependent flag, monthly contribution and contact details. Members are used to attribute expenses and income to individuals and to analyse spending per member.
Expenses are the operational heart of the module. Each expense records a label, household, member, category, amount, date, payment method and supplier, plus “essential” and “recurring” flags. Categories are displayed as colour-coded chips for instant reading.
· 13 built-in categories — electricity, water, gas, heating, internet/telecom, food, transport, health, education, leisure, housing, subscriptions and other.
· Automatic classification — each expense is tagged as essential or discretionary and recurring or one-off.
· Full history — twelve months of history with seasonal variation (e.g. higher energy in winter).
· Overspend detection — expenses feed the budget engine that raises alerts when a category exceeds its threshold.
An expense card exposes a KPI cockpit (amount, category, essential and recurring status) and, as a hub object, its own linked-records panel.
Income is recorded per household and per member, with a type, amount, date, frequency and recurrence flag. Supported income types include salary, secondary income, subsidies / benefits, rental income and passive income, giving a complete monthly view of the household's resources.
A budget line is created per household, per category and per period (month, in YYYY-MM format), with a planned amount and an alert threshold. The actual amount is recomputed automatically from the recorded expenses.
The dedicated Budget vs Actual board compares, household by household and category by category, the planned budget against real spending. Progress bars and usage badges immediately highlight categories that are close to, or over, their limit, and a per-household summary counts the over-budget categories.
Subscriptions (internet, telecom, streaming, insurance, energy, software) are tracked as a hub object with monthly cost, billing cycle, start date, renewal date and active status. The module computes the monthly and annual cost, and the alert engine raises a reminder when a subscription is due for renewal within fifteen days.
Utility readings capture electricity, water, gas and heating consumption: reading date, meter index, consumed quantity, unit, unit cost and total cost. These readings power the energy analysis and let households monitor consumption trends and detect peaks over time.
Domestic bills track amounts, issue / due / payment dates and payment status (paid, pending, overdue), with a recurring flag and a link to the supplier. They complement the native Dolibarr supplier invoices to give a complete view of household liabilities and due dates.
Financial goals let a household plan ahead: savings, debt repayment, a specific purchase or an emergency fund. Each goal stores a target amount, current amount, target date and the required monthly effort, so progress can be tracked over time.
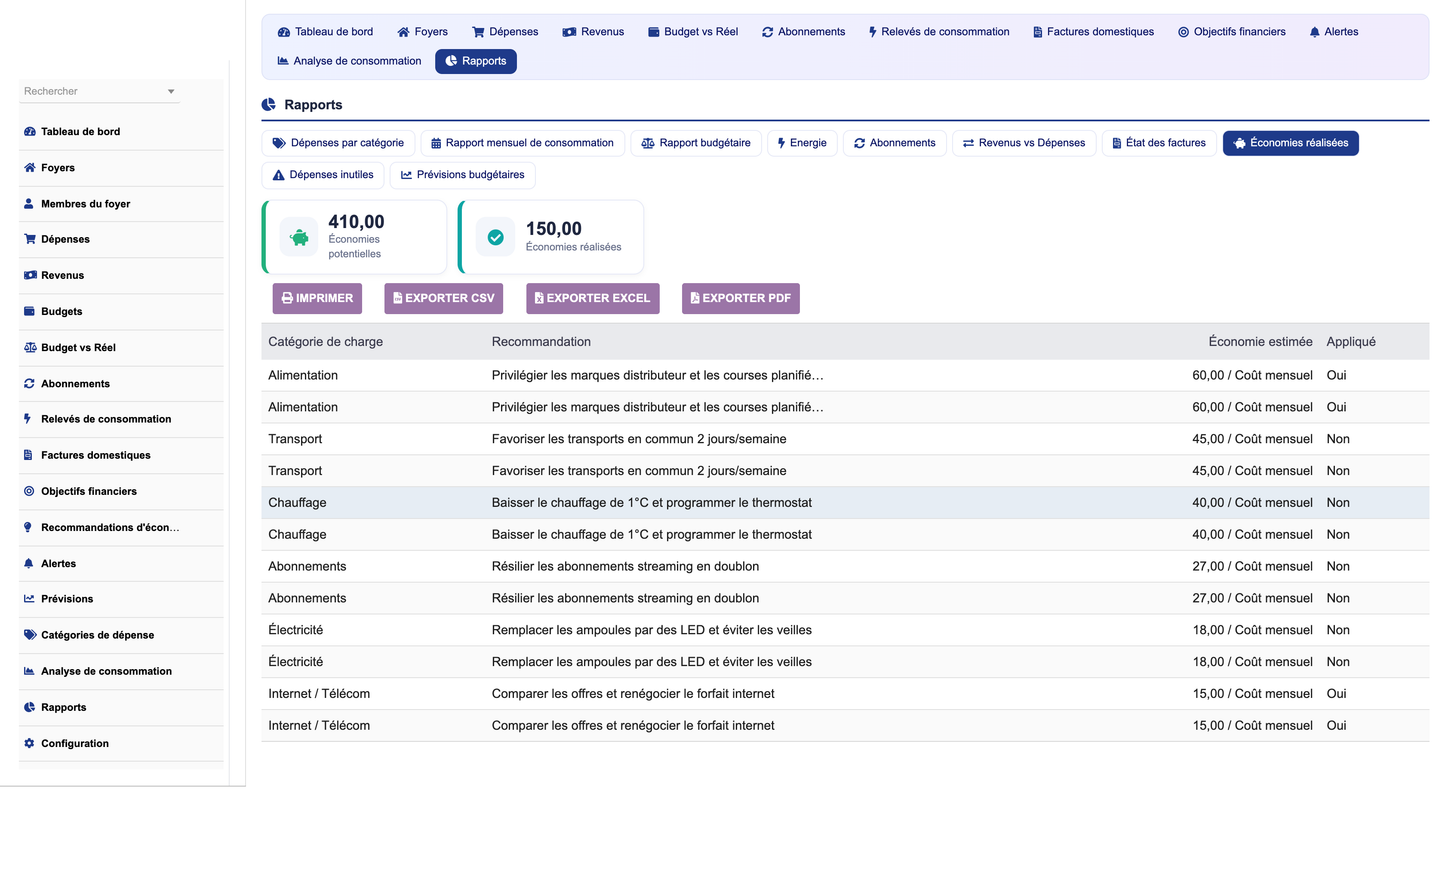
The module includes a rule-based optimisation layer that proposes concrete money-saving recommendations per category, each with an estimated monthly saving, an effort level and an “applied” flag. Examples include switching to LED lighting, cancelling duplicate streaming subscriptions, renegotiating an internet plan or lowering the heating by one degree.
The alerts centre consolidates budget overruns, subscription renewals, consumption peaks and delayed goals, each with a severity level and a read / unread status.
A scheduled task (cron job, “HcRunAlerts”) runs daily and:
· recomputes the actual amount of every current-period budget from expenses,
· raises an overspend alert whenever a budget reaches its alert threshold,
· raises a renewal alert for subscriptions due within fifteen days.
Forecasts estimate future spending per category and per period using a moving-average method, with a confidence percentage. They feed the dashboard's next-month forecast KPI and support monthly and annual budget planning.
Expense categories are fully configurable objects with a code, label, category type, colour, essential flag and optional monthly cap. The thirteen default categories are seeded on activation and drive the colour coding used throughout the module.
The analysis view provides deeper, multi-angle insight into household consumption:
· By category — a bar chart of total spending per category.
· By energy type — a doughnut chart of utility cost.
· By member — spending attributed to each household member.
· Top 10 expenses — the largest individual expenses.
· Timeline — a chronological stream of the most recent expenses.
A complete reporting module offers ten ready-made reports, each with summary KPIs and a data table, and each exportable to PDF, Excel and CSV, plus a print-friendly view.
· Expenses by category
· Monthly consumption report
· Budget report (planned vs actual per category)
· Energy report (quantity and cost per utility)
· Subscriptions report (monthly and annual cost)
· Income vs Expenses (monthly, with savings rate)
· Bills status report
· Savings achieved report
· Wasteful (non-essential) spending report
· Budget forecasts report
An administration page lets the manager configure the default currency, the default overspend alert threshold and the target savings rate.
Two buttons manage the demonstration dataset: one generates a complete, realistic dataset (4 households, ~13 members, 13 categories, ~480 expenses over 12 months, ~130 income entries, 32 budgets, ~20 subscriptions, ~84 consumption readings, ~96 bills, goals, alerts, forecasts, saving recommendations and ~14 native suppliers), and the other removes only the data created by the module. A versioned guard re-seeds an improved dataset on upgrade.
The module ships thirteen business objects. All tables use the llx_household_consumption_ prefix and carry entity, status, creation date and audit columns.
|
Object |
Role |
Type |
|
Household |
Household / foyer with income, budget and savings target |
Hub |
|
Member |
Household member with role and contribution |
Standard |
|
Category |
Configurable expense category |
Configuration |
|
Expense |
Daily expense with category, member and supplier |
Hub |
|
Income |
Income by type (salary, benefit, rental...) |
Standard |
|
Budget |
Planned vs actual amount per category and period |
Standard |
|
Subscription |
Recurring subscription with renewal tracking |
Hub |
|
Consumption |
Utility meter reading (elec/water/gas/heating) |
Standard |
|
Bill |
Domestic bill with payment status |
Standard |
|
Goal |
Financial / savings goal |
Standard |
|
Alert |
Overspend / renewal / peak alert |
Standard |
|
Forecast |
Category forecast per period |
Standard |
|
Saving |
Money-saving recommendation |
Standard |
· Granular permissions — nine right groups (households & members, expenses & income, budgets, subscriptions, consumption & bills, goals & savings, alerts & forecasts, categories & configuration, reporting) with read / write / delete rights; read and write are granted on activation.
· Secure queries — all SQL is escaped and numeric values are cast; CSRF protection uses Dolibarr tokens; output is XSS-escaped.
· Multi-company — full multi-entity support via Dolibarr's entity mechanism.
· Self-healing schema — missing columns are added automatically on upgrade.
· Standard structure — class, admin, core, sql, lib, css, js, img, langs and tpl folders, following Dolibarr conventions, with the llx_household_consumption_ table prefix.
The module is fully translated into French, English, Spanish, Italian and German.
Publisher: DoliResources · https://www.doliresources.com
© 2026 DoliResources — All rights reserved.


