
Discover powerful Dolibarr extensions designed to automate your business processes


HR Organization Chart Management (Gestion des Organigrammes RH) turns Dolibarr into a complete platform to build, manage, historize and analyze an organization's org charts and organizational structures. Where Dolibarr natively records users and third parties, this module adds a dedicated organizational layer: it models the full chain of organizational units, the positions attached to them, the collaborators who fill those positions and the reporting lines that connect everyone - and then keeps a living, analyzable picture of the whole enterprise structure.
The module is built around a generic object engine driving 35 dedicated database tables (all prefixed llx_gorh_). From the referential of organizational units down to positions, collaborators, succession plans, mobilities and reorganization simulations, every concept an HR organization designer needs is a first-class object with its own list and record (card) pages, its own permissions and its own place in the interactive org chart.
· HR Directors (HRD) who need a single source of truth for the enterprise structure, its evolution over time, and its organizational risks.
· Organization designers who design, redesign and document hierarchical, functional, matrix and geographic organizations.
· Managers and department heads who need to see their team, their span of control, their vacancies and their reporting lines at a glance.
· General management who plan reorganizations, mergers, subsidiary creation and workforce budgeting and want to simulate their impact before committing.
· HR managers and administrators who track positions, headcount targets, vacancies, mobilities and succession readiness.
· A true organizational data model - units, positions and collaborators are separated, so a vacant position exists even when nobody fills it.
· An interactive org chart with zoom, navigation and click-to-record, in multiple representations (hierarchical, functional, matrix, geographic).
· A decision-grade dashboard - the Organization Intelligence Center - that scores organizational health and surfaces structural risks.
· A reorganization simulator that projects the impact of closing, growing or reducing a unit before any change is made.
· Deep native integration with Dolibarr Users, Third parties, HR, Agenda, Projects and document management (GED), plus a REST API.
The organization chart is the visual heart of the module. It renders the organization as an interactive, navigable diagram built directly from the live data model - departments, services, teams, positions and the collaborators who occupy them - so the chart is never a static drawing that drifts out of date, but an always-current view of the real structure.
· Zoom - zoom in and out to move from a full-enterprise overview down to a single team without losing context.
· Navigation - pan across the structure, expand and collapse branches, and focus on any sub-tree of the organization.
· Click-to-record - click any node (a unit, a position or a collaborator) to open its full record card, where all attributes, links and history are available.
· Live rendering - because the chart is generated from llx_gorh_department (fk_parent tree), llx_gorh_position and llx_gorh_employee, any change to the underlying data is immediately reflected.
The same organization can be viewed through several complementary lenses, each answering a different management question:
· Hierarchical view - the classic reporting tree following manager-to-collaborator links and the parent chain of organizational units.
· Functional view - grouping by function, job family and area of responsibility, independent of the strict reporting line.
· Matrix view - representing dual reporting, where a collaborator answers to both an operational manager and a functional manager (typical of project-based and cross-functional organizations).
· Geographic view - organizing units by company, establishment, agency and site to reflect a multi-location or multi-entity footprint.
The chart can be drawn at any level of the organization. You choose the entry point and the module builds the sub-tree beneath it:
· Per company and per establishment (multi-entity and multi-site organizations).
· Per division, department and service.
· Per team, cell and unit.
This makes the org chart equally useful to top management (whole-group view) and to a single service head (my-team view), from the same underlying data.
Organizational units are the backbone of the module. They are all modeled through the llx_gorh_department table, whose dept_type field carries the unit level and whose fk_parent field builds the hierarchical tree. A single, recursive model therefore supports the entire spectrum of organizational granularity, from an international group down to a two-person cell.
The referential covers the full range of organizational unit types. Each unit records its parent (fk_parent), its manager (fk_manager), its linked third party (fk_soc), its location, and both its current and target headcount (headcount and headcount_target):
|
Unit level |
Typical use |
|
Group |
Top-level consolidating entity across companies |
|
Holding |
Ownership / financial umbrella structure |
|
Company |
A legal company (linked to a Dolibarr third party) |
|
Subsidiary |
A controlled company within the group |
|
Establishment |
A registered establishment of a company |
|
Agency |
A commercial or operational agency |
|
Site |
A physical location or workplace |
|
Division |
A major operational or business division |
|
Department |
A functional department |
|
Service |
A service within a department |
|
Office |
An office or bureau |
|
Team |
An operational team |
|
Cell |
A small working cell |
|
Unit |
A generic elementary organizational unit |
Every organizational unit is more than a label. The department object stores the operational attributes that drive analytics and reporting:
· dept_type - the unit level (Group, Company, Department, Service, Team, and so on).
· fk_parent - the parent unit, forming the recursive organizational tree.
· fk_manager - the collaborator or user responsible for the unit.
· headcount / headcount_target and - current effective headcount versus the budgeted / target headcount, the basis of under- and over-staffing analysis.
· location / cost_center and - geographic and cost-center attribution for multi-site and budget reporting.
· fk_soc - the linked Dolibarr third party, so an organizational company maps to an accounting entity.
Because units nest freely through fk_parent and each can carry its own fk_soc, the module naturally represents Holding / Subsidiary / Group arrangements and multi-entity groups. A holding can own several companies, each company can own several establishments, and each establishment can contain divisions, departments, services and teams - all in one coherent, navigable tree.
Positions (llx_gorh_position) are modeled independently of the people who fill them. This separation is deliberate and important: it lets the organization describe what work should exist, budget for it, and track vacancies - regardless of whether a collaborator currently occupies the seat.
Each position records how many seats are budgeted and how many are actually filled, so vacancies are computed structurally rather than guessed:
· nb_positions - the number of budgeted seats for this position.
· nb_filled - the number of seats currently filled by collaborators.
· Vacancies - the difference (nb_positions minus nb_filled) is the vacancy count, feeding the vacancies list and the workforce analytics.
Any position can be flagged as critical through the is_critical field. Critical positions are those whose vacancy would seriously disrupt the organization; they are highlighted in the org chart, drive succession planning, and are monitored by the dashboard's risk indicators.
Positions carry the full compensation and seniority framework:
· grade - the professional grade attached to the position.
· job_level - the job level (for example junior, confirmed, senior, expert, management band).
· min_salary / max_salary and - the salary range (minimum and maximum) budgeted for the position.
· required_experience - the expected experience for the role.
· position_type / fk_jobfamily - the position category, and its link to a job family.
· mission - the mission statement and core responsibilities of the position.
· fk_department - the department the position belongs to, anchoring it in the organizational tree.
· fk_manager - the manager position / person the role reports to.
Positions are grouped into job families (llx_gorh_jobfamily), each with a code, a category and a count of attached positions (nb_positions). Job families provide the functional axis of the organization and power the functional view of the org chart, independent of the strict hierarchical line.
The hierarchy view (hierarchie.php) turns the reporting relationships stored on each collaborator into an explicit, analyzable management structure. Every collaborator (llx_gorh_employee) carries an fk_manager link; chaining these links reconstructs the complete reporting tree of the enterprise.
· Employee to manager reporting - each collaborator points to their direct manager through fk_manager.
· Unit and position anchoring - collaborators are also attached to their organizational unit (fk_department) and their position (fk_position), so the hierarchy can be read by person, by unit or by role.
· Multi-level chains - because each manager is themselves a collaborator with their own manager, the module reconstructs the full chain from any individual up to the top of the organization.
For every manager, the module computes the span of control - the number of collaborators who report directly to them. Span of control is a key organizational health signal:
· Overloaded managers (span of control too wide) are surfaced so responsibilities can be rebalanced.
· Very narrow spans of control may reveal unnecessary management layers and excessive hierarchy depth.
The module specifically detects collaborators who have no manager assigned (an empty fk_manager). These orphan nodes usually indicate either the legitimate top of the organization or a data gap that breaks the reporting chain - both worth surfacing explicitly. This control keeps the hierarchy clean and the org chart connected.
By walking the manager chain, the module measures the depth of the hierarchy (the number of management layers between the top and the front line). Excessive depth is a classic sign of a slow, over-layered organization and is tracked as an analytics indicator.
Succession planning protects the organization against the loss of key people. The module models it through two linked objects: succession plans (llx_gorh_succession), each tied to a position and its current incumbent, and the identified successors (llx_gorh_successor) ranked beneath each plan.
A succession plan is anchored on a position (fk_position) and its current holder (fk_incumbent) and records the risk picture around that seat:
· criticality - how critical the position is to the organization.
· risk / vacancy_risk and - the overall risk and the specific risk of the seat becoming vacant.
· bench_strength - the strength of the successor pipeline behind the position.
· succ_status / review_date and - the status of the plan and the date of its next review.
· scenario - a free-text field to document the succession scenario and contingency.
Each succession plan lists one or more candidate successors, each with a maturity and fit assessment:
· readiness - readiness horizon (for example ready now, ready in 1-2 years, ready in 3+ years).
· succ_rank - the priority order of successors within the plan.
· fit_score - a quantified fit between the candidate and the target position.
· risk - the specific risk attached to relying on this successor.
By combining the criticality of positions (is_critical on the position, criticality on the plan) with the readiness and number of successors, the module gives management a clear read on bench strength: which critical positions are well covered, which have a thin or not-ready pipeline, and where the organization is exposed. Critical positions at risk are escalated to the dashboard and alerts.
On top of the structural data, the module computes a set of organizational intelligence indicators that transform raw structure into management insight. These are calculated from the live objects (units, positions, collaborators, reporting links) and drive both the dashboard and the reporting module.
· Occupancy rate - the ratio of filled seats (nb_filled) to budgeted seats (nb_positions) across positions and units.
· Supervision ratio (span of control) - the average and per-manager number of direct reports, revealing overloaded or under-used managers.
· Hierarchy depth - the number of management layers between the top of the organization and the front line.
· Understaffed units - units whose effective headcount is below their headcount_target.
· Overstaffed units - units whose effective headcount exceeds their headcount_target.
· Critical positions at risk - critical positions with weak bench strength or a not-ready successor pipeline.
Each indicator is designed to point directly at an action. Understaffed critical services trigger recruitment or mobility; overstaffed units feed reorganization scenarios; wide spans of control suggest adding a management layer, while excessive depth suggests removing one; and critical positions at risk drive succession reviews. The analytics therefore close the loop between observing the organization and reshaping it.
Structural risks are materialized as alerts (llx_gorh_alert), each with a type, a severity, an optional linked collaborator, trigger and due dates, a status and a message. Alerts keep organizational risks visible and actionable rather than buried in a report.
The reorganization simulator (simulations.php) lets HR and management model structural changes before committing to them. Instead of editing the live organization and hoping for the best, users describe a scenario and the module projects its consequences on headcount, collaborators and neighbouring units.
· Close a unit - project the effect of shutting down a department, service or team, including where its collaborators and positions would need to be reassigned.
· Grow a unit - model an expansion, adding budgeted positions and headcount, and see the resulting structure and cost.
· Reduce a unit - model a downsizing, reducing positions or headcount, and identify who and what is affected.
For each scenario, the simulator returns a structured impact analysis:
· Projected headcount - the headcount of the target unit and of the wider organization after the change.
· Affected collaborators - the collaborators directly touched by the scenario (reassigned, at risk, or newly needed).
· Impacted units - the neighbouring and parent units whose structure, span of control or headcount would change.
Because simulations are computed on top of the live model without altering it, they can be run and re-run freely. This makes the simulator a genuine decision-support tool for mergers, subsidiary creation, service consolidation and workforce budgeting - the impact is understood before a single collaborator is moved.
The reporting module (reporting.php) consolidates the organizational data into a set of ready-to-use reports covering structure, headcount, occupancy and talent movement. Reports are built from the same live objects as the dashboard, so figures are always consistent across the module.
|
Report |
Content |
|
Organizational structure |
Units by level, parent chain, managers and locations |
|
Headcount |
Effective vs target headcount by unit, company and establishment |
|
Positions & occupancy |
Budgeted vs filled seats, vacancies and occupancy rate |
|
Span of control |
Direct reports per manager, overloaded and under-used managers |
|
Succession |
Critical positions, bench strength, successor readiness |
|
Mobility |
Internal moves between positions and departments |
|
Turnover |
Movement in and out of units and positions |
Every report and object list can leave the module in the format the audience needs:
· CSV / Excel export - for further analysis in a spreadsheet or a BI tool.
· Print-ready view - clean, formatted output for meetings and archiving.
· API access - the underlying data is also reachable through the REST API for automated reporting pipelines.
The dashboard (dashboard.php) is the module's flagship decision surface: a premium Organization Intelligence Center that condenses the entire organizational picture into a single screen. It is designed for HRDs and general management who need to grasp the state and the risks of the organization in seconds.
At the top of the dashboard, an overall organizational health score summarizes the state of the structure in a single figure, computed from the underlying indices and indicators. It gives leadership an immediate, high-level read on whether the organization is well balanced or under strain.
· 8 organizational indices that break the health score down into dimensions such as structure, staffing, supervision, succession and mobility.
· ~24 KPIs - approximately 24 key performance indicators covering headcount, occupancy, vacancies, span of control, hierarchy depth, critical positions and talent movement.
· Embedded org chart - the same interactive org chart embedded in the dashboard for immediate visual context.
· Visual analytics - charts and graphs that render the distributions and trends behind the numbers.
· Alerts panel - the alert feed that raises understaffing, overloaded managers and critical positions at risk.
The Organization Intelligence Center is not a passive display. Its indices and alerts point straight at the parts of the organization that need attention, and every element is clickable, leading down into the relevant list or record. It brings the analytics of section 7, the simulations of section 8 and the reporting of section 9 together into one coherent command center.
Collaborators (llx_gorh_employee) are the people who bring the organization to life. Their records are deliberately rich, linking each person to a Dolibarr user, a third party, a department, a position and a manager, and carrying the attributes needed for organizational and talent analysis.
· Identity - name, gender, birth date, contact details, address and photo.
· Employment - contract type, hire date and computed seniority.
· fk_department, fk_position, fk_manager , and - the collaborator's place in the structure.
· Grade, level and pay and - job level, grade and salary.
· Profile attributes - languages, diploma, and employment status round out the profile.
Mobilities (llx_gorh_mobility) record moves of collaborators through the organization. Each move captures its type (mobility_type), the origin and destination positions (fk_from_position / fk_to_position) and departments (fk_from_dept / fk_to_dept), the effective date, a status and a reason. Mobilities feed both the mobility report and the history timeline.
Promotions (llx_gorh_promotion) capture upward moves in grade and position. Each promotion records the from and to grade (from_grade / to_grade), the origin and target positions, the effective date, the salary before and after (salary_before / salary_after), a status and a reason - giving a complete, auditable promotion history.
· Career paths - career plans (llx_gorh_careerplan) describe the intended trajectory of a collaborator through positions and grades.
· History timeline - the history view (historique.php) reconstructs a chronological timeline of structural and individual changes, so the evolution of the organization and of each collaborator is preserved and auditable.
The module is a first-class Dolibarr citizen. Rather than duplicating data, it links to the native modules and reuses the platform's core services, so the organizational layer stays consistent with the rest of the ERP.
· Users - collaborators link to Dolibarr users (fk_user); permissions and login reuse the native user system. The module depends on modUser.
· Third parties - organizational companies and collaborators link to third parties (fk_soc), connecting the org structure to accounting and commercial entities. The module depends on modSociete.
· HR - the module complements Dolibarr's native HR features, adding the organizational and structural dimension around them.
· Agenda - reviews, succession review dates and alerts align with the Dolibarr calendar.
· Projects - the matrix and functional views support project-based and cross-functional organizations tied to Dolibarr projects.
· GED (document management) - organizational documents attach through the document object (llx_gorh_document) and Dolibarr's document management.
A dedicated REST API (class Gestionorganigrammesrh, base URL /api/index.php/gestionorganigrammesrh/) exposes the module's data to external systems - ATS, HRIS and BI tools. Endpoints include talents, candidates, recruitments, evaluations, the skill matrix, successions and consolidated dashboard KPIs. Access is authenticated and each route is guarded by the same fine-grained module rights as the web UI, with sort fields whitelisted against the real table columns for safety.
Access is controlled by a fine-grained permission model that follows Dolibarr's native rights framework. Permissions are organized into nine functional groups, each with its own read, write and delete controls, for a total of around 26 permissions plus a module administration right.
|
Permission group |
Scope |
|
referential |
Organizational units, structures, positions, job families |
|
talent |
Collaborators and talent records |
|
recruitment |
Recruitment and candidate data |
|
skills |
Skills and competency data |
|
performance |
Responsibilities, objectives and performance |
|
career |
Succession, successors, mobility, promotions, career paths |
|
development |
Development, training and coaching |
|
analytics |
Simulations, history, documents and alerts |
|
reporting |
Reporting module (read access) |
Each group (except reporting, which is read-only) exposes three separate rights - read, create/modify and delete. After activation, read and write are granted by default so the module is immediately usable, while delete and module administration stay disabled until an administrator explicitly grants them. This lets organizations expose the org chart broadly for consultation while tightly restricting who can change or remove structural data.
· Audit trail - every object records its creation date, last modification timestamp, and the users who created and last modified it (fk_user_creat, fk_user_modif), giving a complete audit trail.
· Multi-entity - every table carries an entity column, so the module operates correctly in Dolibarr multi-company (multi-entity) installations, keeping each entity's organization isolated.
· API-side enforcement - the REST API resolves rights from the authenticated caller and rejects any route the user is not entitled to.
The module is built on a generic object engine that keeps the codebase consistent and maintainable across its large object catalogue. Understanding this architecture helps administrators and integrators extend and operate the module with confidence.
List and record (card) pages are registry-driven: a shared engine (objectlist.inc.php, objectcard.inc.php and their renderers) generates the standard list, filter, sort and record UI for every object from a central registry, rather than hand-coding each screen. This gives all 35 objects a uniform look and behaviour and makes the module easy to extend.
· 35 objects/tables - all prefixed llx_gorh_, covering the referential (departments, positions, job families), people (collaborators), organizational dynamics (succession, successors, mobility, promotion, career plans), and supporting objects (documents, alerts, and more).
· Standard schema - each table carries standard columns (rowid, entity, ref, status, date_creation, tms, fk_user_creat, fk_user_modif, import_key) for consistency, multi-entity support and auditing.
· Self-healing schema - a self-healing schema routine (gorhEnsureSchema) runs on activation to verify and repair the table structure, so upgrades and partial installs converge to the correct schema.
The interface is fully translatable through per-language .lang files. The module ships translations for five languages - French (fr_FR), English (en_US), Spanish (es_ES), Italian (it_IT) and German (de_DE) - all loaded from the gestionorganigrammesrh language domain. All labels, menus and vocabulary are provided as language keys, never hard-coded.
· Menu tree - a dedicated top menu and a rich left menu (dashboard, org charts, hierarchy, structures, companies, establishments, departments, services, teams, positions, functions, collaborators, vacancies, succession, mobilities, promotions, career paths, simulations, history, reporting and setup), all module-local so they never collide with core pages.
· Front-end assets - the module ships its own CSS and JavaScript (served through css/ and js/) that render the interactive org chart, the dashboard and the marine/teal visual identity.
· REST API class - the REST layer is delivered by the Gestionorganigrammesrh API class, wired into Dolibarr's Restler-based API framework.
Installing the module follows the standard Dolibarr external-module procedure. No command line or database work is required beyond copying the files.
1. Copy the files - Place the gestionorganigrammesrh folder into your Dolibarr htdocs/custom/ directory (the standard location for external modules).
2. Open the module manager - Sign in as an administrator and go to Home > Setup > Modules/Applications.
3. Find and activate - Locate 'HR Organization Chart Management' under the Human Resources family and activate it. On activation the module creates its 35 tables, menus and rights, and runs the self-healing schema check.
4. Demo data auto-seeds - On first activation the module automatically seeds a coherent set of demonstration data (organizational units, positions, collaborators, hierarchy, succession and history), so you can explore every feature immediately.
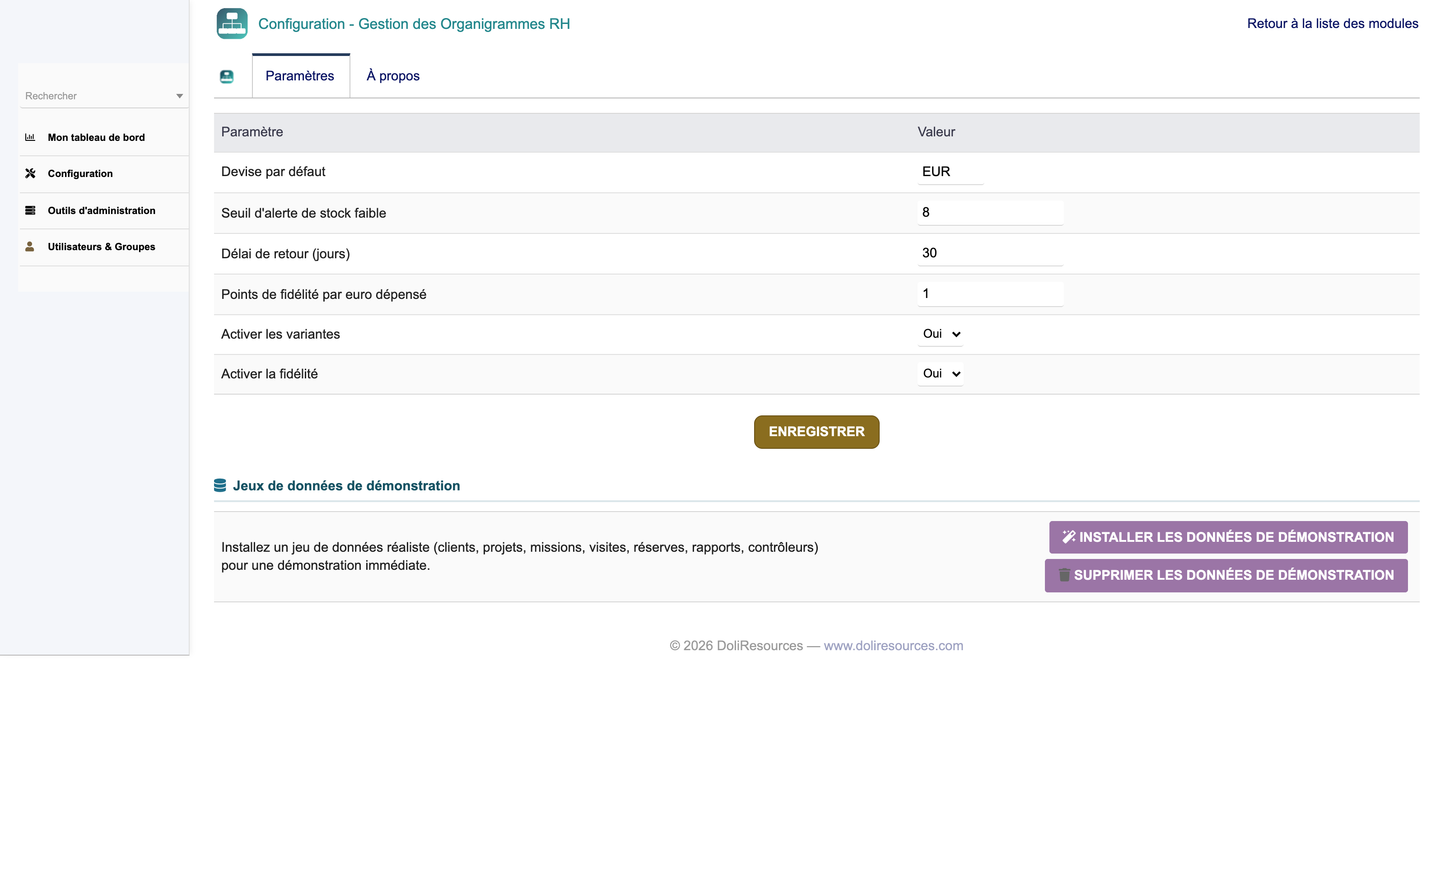
5. Configure - Open the module setup page (admin/setup.php) to adjust options, and grant delete or administration rights to the relevant users.
The setup page provides two dedicated buttons to manage the demonstration dataset at any time:
· Populate demo data - (re)generate the full coherent demo dataset to explore or showcase the module.
· Delete demo data - cleanly remove all demonstration records when you are ready to enter real data.
· Dolibarr 16 to 23.
· PHP 8.x.
· MySQL or MariaDB.
· The native modules Users (modUser) and Third parties (modSociete), which the module depends on.
The module is designed for a wide range of HR and management profiles. Combined with the nine permission groups and their read/write/delete granularity, the following roles can be tailored precisely to each person's responsibilities:
|
Role |
Typical responsibilities |
|
HR Admin |
Full technical administration of the module and its rights |
|
HR Manager |
Day-to-day management of positions, collaborators and mobility |
|
HRD (HR Director) |
Enterprise-wide oversight, health score and organizational strategy |
|
General Management |
Top-level structure, reorganization simulations, key decisions |
|
Organization Manager |
Design and maintenance of the organizational structure |
|
Manager |
View and manage own team, span of control and vacancies |
|
Department Head |
Management of a department, its services and headcount |
|
Service Head |
Management of a service and its teams |
|
Recruitment Officer |
Vacancies, recruitment and candidate follow-up |
|
Collaborator |
Consultation of the org chart and own record |
|
Auditor |
Read-only access to structure, history and audit trail |
Because access is granted per permission group and per operation, each of these roles maps cleanly onto the module's rights: an auditor receives read on all groups, a collaborator receives read on the referential, a service head receives write on their scope, and an HR admin receives the administration right - all without any code change.
HR Organization Chart Management - Gestion des Organigrammes RH
Version 1.0.0 - (c) 2026 DoliResources - www.doliresources.com - GNU GPL v3+


