
Discover powerful Dolibarr extensions designed to automate your business processes
Smart Irrigation Management turns Dolibarr into a specialised water-management solution for agriculture. It lets a farm, an estate, a cooperative, a local authority or...
Couldn't load pickup availability


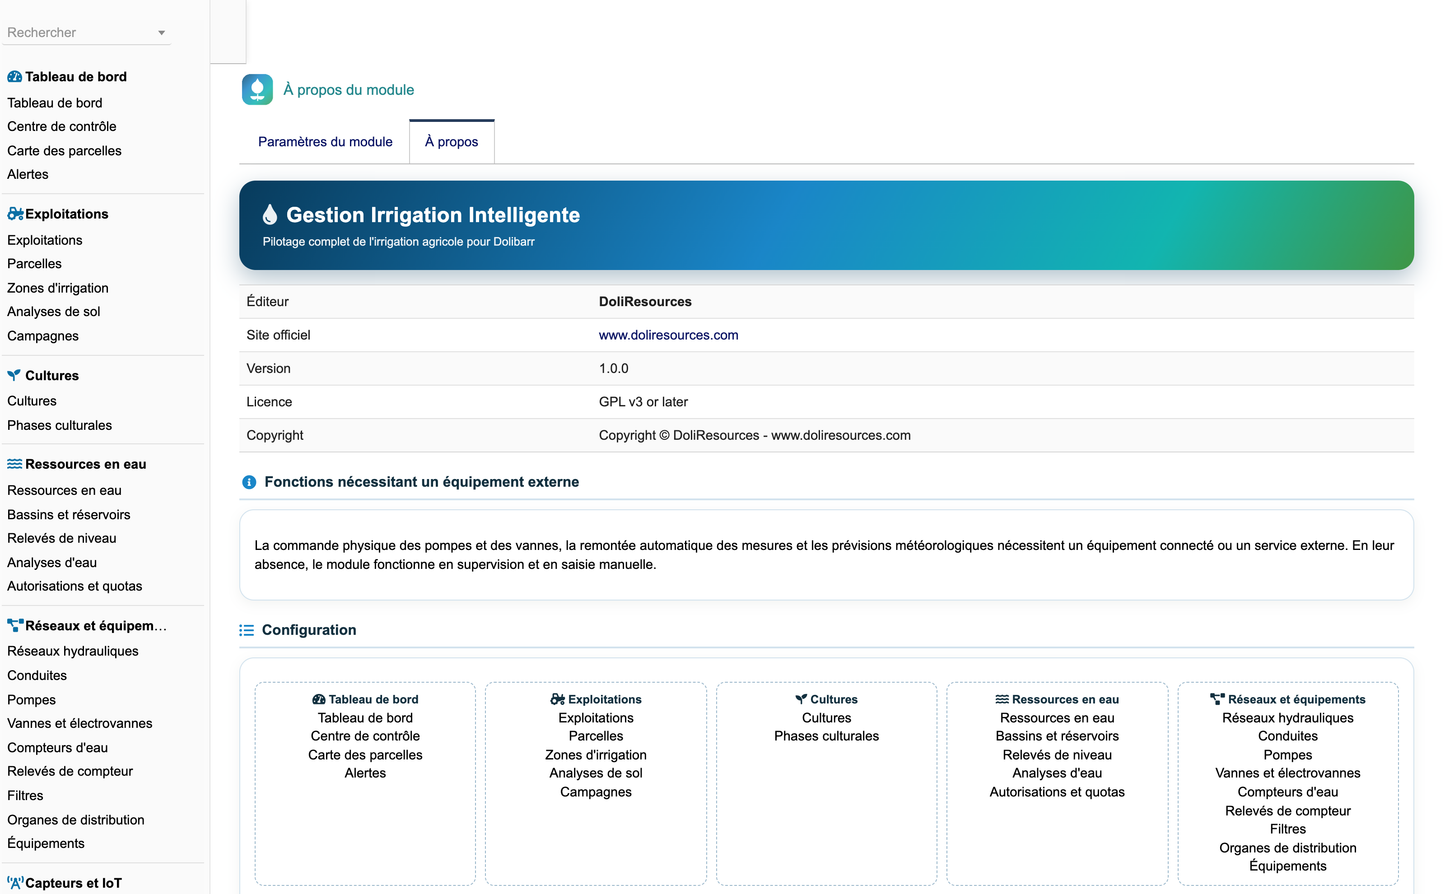
Smart Irrigation Management turns Dolibarr into a specialised water-management solution for agriculture. It lets a farm, an estate, a cooperative, a local authority or an irrigation contractor plan, automate, monitor and optimise every drop of water applied to a crop — from plot mapping through to the financial result of the campaign — without depending on a second piece of software.
The module ships 57 business objects, 57 dedicated database tables, 38 granular permissions, 86 menu entries, a smart dashboard, a real-time control centre, a dynamic plot map, a documented water requirement engine, an automation rule engine, twelve report families exportable to CSV, Excel, Word and PDF, a REST API including an IoT ingestion endpoint, and a realistic demonstration dataset.
Scope of the tool
Smart Irrigation Management is a management and decision-support tool. Physical control of pumps and valves, automatic measurement collection and weather forecasts require connected equipment or an external service; without them the module works in supervision and manual-entry mode and no management feature is lost. The module replaces neither agronomic diagnosis nor the hydraulic design work of an engineering office.
· Structure farms, plots and independent irrigation zones in a single reference system.
· Know the water requirement of every crop at every growth stage.
· Plan irrigation, automate watering programmes and keep a full execution history.
· Compare planned and actual volumes, and quantify the water actually saved.
· Integrate weather records and forecasts into the scheduling decision.
· Collect sensor data: soil moisture, temperature, pressure, flow, level, rainfall, wind.
· Detect leaks, prevent under-irrigation and over-irrigation, limit waste.
· Optimise energy consumption and measure the energy spent per cubic metre pumped.
· Schedule fertigation and keep target versus actual pH and EC under control.
· Manage pumps, valves, meters, filters and emitters, and their maintenance.
· Compute the true cost of irrigation and measure water performance.
· Produce operational and financial reports, and export them in four formats.
· Manage suppliers, contracts and customer installations, and link them to Dolibarr quotations, orders and invoices.
|
Sector |
Typical use |
|
Field crops |
Pivot and linear-move scheduling, water balance per plot |
|
Market gardening |
High-frequency drip scheduling, fertigation, greenhouse control |
|
Fruit growing |
Micro-sprinkling, water requirement per growth stage |
|
Wine growing |
Deficit irrigation strategies, quota tracking |
|
Palm and olive groves |
Long cycles, large volumes, energy cost per cubic metre |
|
Nurseries and greenhouses |
Misting, cooling, fertigation recipes |
|
Green spaces and golf courses |
Sprinkler networks, night-time consumption control |
|
Local authorities |
Abstraction permits, quotas, restriction levels |
|
Cooperatives |
Multi-farm supervision, shared collective networks |
|
Irrigation contractors |
Customer installations, maintenance contracts, service margin |
The farm is the top-level container: it carries the linked Dolibarr third party, the owner, the operator, the manager, the address, the GPS coordinates, the altitude, the total and irrigated areas, the farm type, the climate type, the dominant soil, the number of plots and zones, and the annual volume and cost targets. Photographs, documents, public and private notes are attached through the native Dolibarr mechanisms.
The plot is the reference unit of the water balance. It carries a full agronomic description together with its irrigation setup:
|
Group |
Fields |
|
Identification |
Reference, name, land parcel code, block, sector, farm |
|
Geometry |
Total area, irrigated area, GPS latitude and longitude, map polygon, altitude, slope, aspect |
|
Soil |
Type, texture, depth, pH, salinity, available water capacity, organic matter, drainage |
|
Crop |
Current crop, variety, planting date, planting density, growth stage |
|
Irrigation |
Method, water source, nominal flow, average water need, target yield |
|
Management |
Status, manager, observations |
Nine statuses follow the life cycle: being prepared, active, irrigated, not irrigated, fallow, under maintenance, alert raised, suspended, inactive.
The zone is the physically controllable unit: it carries the valve, the meter, the pump and the emitters. It defines the target volume, the target duration, the frequency, the priority and the minimum and target moisture thresholds. A zone can be suspended temporarily without touching either the plot or the programme.
The crop dictionary carries the scientific name, botanical family, category, cycle length, rooting depth, initial, mid-season and late crop coefficients, minimum, optimum and maximum moisture thresholds, water-stress and salinity tolerance, recommended irrigation method, recommended frequency and target yield.
Every crop is broken down into growth stages — planting, establishment, vegetative growth, flowering, fruit set, ripening, harvest and dormancy — each carrying its own crop coefficient, water requirement, moisture threshold, duration and irrigation strategy. The requirement engine uses the coefficient of the stage in progress and falls back to the mid-season coefficient when the stage is unknown.
A campaign delimits the irrigation season with its start and end dates, its manager and its volume, cost and energy targets. Actual figures are consolidated from the executions, so a campaign total can never contradict the sum of its own irrigations. Eight statuses are available: draft, planned, approved, in progress, suspended, completed, closed, cancelled.
Twelve source types are managed: well, borehole, dam, reservoir, tank, canal, collective network, recycled water, desalinated water, river, natural spring and rainwater. Each source carries its depth, capacity, current volume, nominal and actual flow, static and dynamic levels, cost per cubic metre, water quality, pH, salinity, conductivity, temperature, turbidity and last analysis date.
Basins and tanks are managed separately with their capacity, current volume, minimum and maximum levels, filling and draining systems, level sensor, cleaning and maintenance dates. Level readings, water analyses and abstraction permits with their annual quota, monthly cap, used volume, restriction level and expiry date complete the picture.
The network is described hierarchically — main network, sub-network, sector, head station and distribution — each element optionally carrying a parent. Pipes carry their type, material, diameter, length, nominal pressure and flow, supplier, cost, warranty and maintenance dates. Filters carry their type, mesh, flow, pressure drop and cleaning interval; emitters carry their type, unit flow, spacing, working pressure and distribution uniformity.
|
Object |
What is managed |
|
Pumps |
Eight types from submersible to solar and backup; power, nominal flow and pressure, manometric head, energy source, efficiency, running hours, cumulated energy, install date, supplier, cost, warranty, condition, maintenance dates |
|
Valves |
Manual, solenoid, motorised, main, secondary, control, check and air-release valves; control mode, diameter, pressure, last opening and closing, cycle count, communication state, condition |
|
Water meters |
Six types up to smart meters; initial and current index, unit, accuracy, calibration date, reading source, last reading, anomaly flag |
Meter readings can be entered manually, imported, synchronised automatically or captured from the mobile terminal; the origin of every reading is preserved, and an inconsistent reading is flagged as an anomaly.
Eighteen sensor types are managed: soil moisture, soil temperature, air temperature, air humidity, pressure, flow, water level, rainfall, wind, solar radiation, conductivity, pH, salinity, electricity meter, water meter, leak detector, tensiometer and dendrometer.
Each sensor carries its manufacturer, model, serial number, GPS position, installation depth, protocol, unit, reading interval, minimum and maximum thresholds, last value, last communication date, battery level, signal quality, calibration dates and status. A value outside the sensor's own thresholds is automatically flagged as an anomaly and feeds the alert engine.
Connectors and ingestion
Seven connector types are available: REST API, MQTT broker, HTTP webhook, CSV import, IoT gateway, industrial PLC and weather API. No credential is ever stored in clear text: a connector only carries a reference to the entry held in the instance credential store. Every synchronisation writes a log line with its duration, record count, error count and result.
Weather stations carry their manufacturer, model, position, altitude, sensor count and transmission interval. Daily records carry minimum, maximum and average temperature, humidity, rainfall, wind speed and direction, radiation, atmospheric pressure, dew point and reference evapotranspiration. Forecasts add rain probability, frost risk and extreme-heat risk.
The weather page states explicitly what each forecast day implies for the programmes: forecast rain above the threshold postpones the run, excessive wind suspends sprinkling, a frost risk raises an alert, and extreme heat increases the frequency.
A programme carries the campaign, the plot, the zone, the crop, the planned date and time, the planned duration, volume, flow and pressure, the water source, the pump and the valve. Six scheduling modes are available (one-off, recurring, daily, weekly, by interval, seasonal) and seven trigger modes (manual, calendar, soil moisture, evapotranspiration, weather, soil tension, water balance).
A monthly calendar shows every programme at its date with a colour code for planned, approved, completed and overdue runs. Executions record the actual start and end times, duration, planned and actual volume, average flow and pressure, moisture before and after, temperature, rainfall, pump, valve, meter, operator, energy, water cost, energy cost, execution mode, incident and status.
The engine computes the water balance of every plot and the formula is displayed in the page itself: nothing is computed in a black box.
· Crop evapotranspiration: reference evapotranspiration multiplied by the crop coefficient of the stage in progress.
· Net requirement: crop evapotranspiration minus effective rainfall, floored at zero.
· Gross volume: net requirement multiplied by the irrigated area, divided by the system efficiency (one millimetre over one hectare is ten cubic metres).
· Duration: gross volume divided by the nominal flow of the zone, clamped between the configured minimum and maximum durations.
· Deficit: the gap between measured and target moisture, applied to the available water capacity of the plot.
· Priority: a plot below the minimum moisture of its own crop is raised to critical.
When the manual approval option is active — which is the default — no automation rule starts an irrigation without the farm manager's agreement.
A rule associates a condition, a comparator, a threshold, a unit and an action, with a time window, a delay, an approver and a notification channel. Fourteen conditions and twelve actions are available.
|
Example condition |
Example action |
|
Soil moisture below the threshold |
Propose an irrigation |
|
Forecast rain above the threshold |
Postpone the irrigation |
|
High wind speed |
Suspend the programme |
|
Basin level too low |
Block the start |
|
Pressure too low |
Interrupt the irrigation |
|
Abnormal flow |
Raise an alert |
|
Target volume exceeded |
Close the valve |
|
Pump failure |
Switch to the backup pump |
|
High temperature |
Increase the frequency |
|
High evapotranspiration |
Schedule with priority |
Eight detection methods are supported: planned versus actual volume gap, flow outside the programme, night-time consumption, pressure drop, continuous flow, leak sensor, historical comparison and field observation. Each leak carries its severity, estimated lost volume, estimated cost, location, GPS position, assignee, repair job and status, from suspected through to closed or ruled out.
The fertiliser catalogue carries the formula, nitrogen, phosphorus and potassium content, density, solubility, effect on pH and incompatibilities. Recipes are composed of lines dosed in kilogrammes per cubic metre and their total cost is consolidated from those lines. Each fertigation records the water volume, target and actual dose, target and actual pH, target and actual electrical conductivity, the injector and the operator. Safety controls cover product incompatibility, overdosing, insufficient stock, abnormal concentration, incorrect pH and excessive conductivity.
Maintenance plans define the periodicity, planned duration, estimated cost and checklist per equipment type. Four natures are managed — preventive, corrective, condition-based and regulatory — plus cleaning, calibration and replacement. Each job records the failure, diagnosis, duration, downtime, technician, supplier, parts and labour costs and outcome. Work requests let any field agent report a problem, with a status that follows the job through to closure. Spare parts and stock movements complete the chain.
Energy consumption is recorded per pump and per period with running hours, energy consumed, fuel, pumped volume, efficiency, cost and estimated emissions. The energy per cubic metre is derived from the volume actually pumped rather than drawn independently, so the ratio stays physically credible and a drifting pump becomes visible before it fails.
Fourteen cost categories are managed: water, energy, labour, equipment, depreciation, maintenance, consumables, fertigation, analyses, subscriptions, telecommunications, subcontracting, overheads and abstraction charges. Each cost carries a planned and an actual amount, so the variance is readable without any reprocessing. Budgets are followed per campaign, farm, plot and category with planned, committed and actual amounts; an exceeded budget raises an alert.
The dashboard uses a water-and-agriculture palette: deep blue, water blue, turquoise, agricultural green, earth beige, orange for warnings and red for critical anomalies.
· A header band with the farm, the active campaign, today's weather, the available water, today's consumption, the number of open alerts and a shortcut to the control centre.
· Alert tiles that appear only when they have something to report, each opening the matching list.
· Five half-circle gauges: water efficiency, average basin level, average soil moisture, quota used and programme compliance.
· About thirty indicators grouped into water and resources, network and equipment, sensors and monitoring, and performance and costs.
· An eight-step irrigation cycle from planning to review.
· A dynamic plot map and twelve charts covering consumption, energy, rainfall, soil moisture, alerts, sensor states, irrigation methods, failures, water cost and basin levels.
The control centre is the real-time view: zones being irrigated with their progress towards the target volume, running pumps, open valves, instant flow and pressure, delivered volume and remaining time, next scheduled runs and latest events. Physical commands, including the emergency stop, are enabled only when an IoT connector is active and the user holds the matching permission.
Every plot is drawn as a tile whose width follows its share of the irrigated area. Four colouring modes are available: soil moisture, plot status, water consumption and anomalies. The tooltip gives the crop, area, measured moisture, last and next irrigation, consumed volume and open alerts. The legend describes the active mode only, so it can never describe something the map is not showing.
Twenty-eight alert types are managed, classified as critical, high, medium or informational, and routed through Dolibarr notifications, email, agenda events, the dashboard or an external service. Fourteen live probes are recomputed on every display, so the alert centre is correct even before the daily scheduled job runs.
Twelve report families are available: farms, water consumption, programmes, water balance, weather, sensors, equipment, maintenance, leaks, fertigation, energy and costs. Each report is filterable by period, presents summary indicators, a totalled table and a chart, and exports to CSV, Excel, Word and PDF. Accented characters are correctly decoded in all four formats.
The field-entry screen is designed for a phone: it records a manual irrigation, a meter reading, a leak report or a work request, and shows today's programmes and the latest entries. Labels with QR codes can be produced for plots, zones, pumps, valves, meters, sensors and equipment; scanning a label opens the very same record in Dolibarr.
|
Native object |
How the module uses it |
|
Third parties |
Farms, suppliers, customers, contracts and installations link to a third party |
|
Contacts |
Operational contacts of farms and suppliers |
|
Products and services |
Equipment, spare parts and fertilisers link to a product |
|
Projects |
Installations and contracts link to a project |
|
Quotations, orders, invoices |
Created from an installation or a maintenance job |
|
Supplier invoices |
Attached to a maintenance job or an operating cost |
|
Stock and warehouses |
Spare parts and stock movements |
|
Agenda |
Alerts and interventions can raise agenda events |
|
Document management |
Documents attached to any record |
|
Users and groups |
Managers, technicians, operators and approvers |
|
Scheduled jobs |
Daily alert computation |
|
REST API |
Complete module API including IoT ingestion |
The module is fully available in French, English, Italian, German and Spanish, with 1 591 keys per language. No visible string is hard-coded in PHP or JavaScript. Every key is prefixed, which guarantees that no other installed module can override the module's wording — a measured risk on an instance carrying a large module catalogue.
Two distinct buttons load and clear the demonstration data set. Loading purges then regenerates the complete set, so the result is always the current data set rather than a mixture of two versions. Clearing asks for confirmation, removes only the rows carrying the technical marker — including the native third parties, products and projects created by the seeder — protects real data and reports the number of records removed.
The data set covers two farms, eight plots, twelve irrigation zones, eight crops with their growth stages, three water sources, two basins, six pumps, twelve valves, ten meters, thirty-four sensors with a full year of measurements, two weather stations with a year of daily records, two campaigns, more than seven hundred programmes and their executions, fertigation, maintenance, energy, costs, budgets, suppliers, contracts, installations, teams and alerts.
· Permission check on every page and every action, before any query or output.
· CSRF token on every form, validated by the Dolibarr core, with payloads re-validated field by field against white lists.
· Escaped SQL parameters and sort columns validated against the real schema.
· Output escaping adapted to each format, so accented characters survive every export.
· No credential, API key or token stored in clear text: connectors carry only a reference to the instance credential store.
· Physical commands doubly conditioned by an active connector and an explicit permission.
· Multi-company isolation on every table and every query.
· Confirmation before any deletion, and a purge that removes only marked demonstration rows.
· Sensitive actions written to the Dolibarr log and to the module's own event journal.
|
Method |
Route |
Description |
|
GET |
objects |
The 57 object types, their fields and the caller's permissions |
|
GET |
records/{type} |
Paginated, sorted and filterable list |
|
GET |
records/{type}/{id} |
One record |
|
POST |
records/{type} |
Create |
|
PUT |
records/{type}/{id} |
Update |
|
DELETE |
records/{type}/{id} |
Delete |
|
GET |
dashboard |
Key indicators over the running campaign |
|
GET |
alerts |
Operational alerts and their volume |
|
GET |
waterbalance/{id} |
Complete water balance of one plot |
|
POST |
measures |
IoT ingestion endpoint, sensor addressed by its reference |
Install the ZIP archive from Home, Setup, Modules, Deploy external module, or copy the folder into htdocs/custom/. Enable the module under Setup, Modules, Agriculture and IoT. Activation creates the 57 tables and their indexes, the 38 permissions, the 86 menu entries and the 21 configuration constants, prepares the document directory and loads the demonstration data set. No core Dolibarr file is modified.
· module_irrigationintelligente-1.0.zip — the installable module.
· Screenshots — 91 captures covering every screen of the module.
· Manuel_Formation_Gestion_Irrigation_Intelligente_FR.pdf — the illustrated French user and training manual.
· Smart_Irrigation_Management_Module_Detailed_Features_EN.docx — this document.
· Documentation — README (French and English), INSTALL, CHANGELOG, DATABASE_SCHEMA, API_DOCUMENTATION, IOT_CONNECTORS_DOCUMENTATION, SECURITY_GUIDE, TEST_REPORT, KNOWN_LIMITATIONS and LICENSE.


